Operations | Monitoring | ITSM | DevOps | Cloud
Latest Posts
Monitoring Endpoint Security States with InfluxDB
Several factors in recent years have increased endpoint vulnerability — from organizations’ need to make access to data more fluid, to threats targeting mobile device access and networks, to the growing work-from-home and work-on-the-go trends. Endpoints connected to a network — including remote devices, IoT devices, workstations, tablets, laptops and servers — create attack paths for security threats.
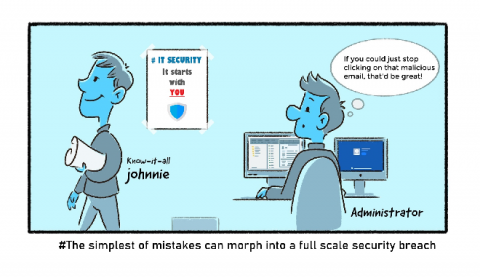
IT security under attack: A typical day in the life of an IT admin or security analyst
The job of IT admins and IT security analysts are, without a doubt, some of the most important jobs in any company. When things are running smoothly, it is easy for everyone to forget they exist. However, the moment things go askew, everyone points fingers at them. IT security professionals are expected to know everything. Most of them are self-taught and have learned on-the-job. Over time, experience has turned them into battle-hardened soldiers.
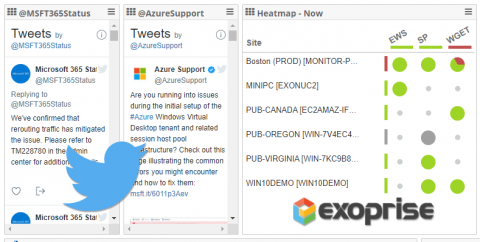
Twitter Outage and Support Feeds Integrated with CloudReady Internet Outage Monitoring
Twitter as a social media channel has obviously taken the world by storm. Everything that happens and is trending around the globe takes place or is reported on Twitter. Additionally, most tech and cloud providers offer outage and support feeds through Twitter as a way of communicating problems and notifying customers. Example technology companies include Microsoft for Microsoft 365 Status, Azure and their products. Also Internet Service Providers like Comcast, CenturyLink and more.
The Easiest Way to Monitor Node.js: Automatic Instrumentation
Monitoring for your Node.js apps can be hard. The tricky part is understanding what you need to monitor, instrumenting your code, and then making sense of all the data that’s been emitted. (That’s almost every part you might say 😅 ). At AppSignal, we dogfood our product and understand the pain users feel ourselves. The key points we focus on are the ease of use, flexibility, and developer experience.
Best Alternatives to Azure Monitor
How to implement CFEngine Custom Promise Types in Python
This tutorial focuses on how to write a promise module, implementing a new CFEngine promise type. It assumes you already know how to install promise modules and use custom promise types, as shown in the previous blog post.
Observability: is it a future of monitoring
As a concept, observability has been a relatively recent entrant into the world of information technology and cloud technology. The idea originated initially from controls system engineering. Observability refers to the concept of inferring the internal status of the system based on the outputs derived from the same. This is the conventional definition of observability.
Knowing How Much to Spend on the AWS Elastic Load Balancer
Load balancing is an element of most popular web applications. The reason for this is simple: Load balancers maintain application scalability and sustainability. It’s nearly impossible to imagine a modern application handling continuous traffic or periodic traffic spikes while relying only on a single running server’s capacity. As a result, load balancers have become a critical part of software development.
How to create fast queries with Loki's LogQL to filter terabytes of logs in seconds
LogQL, the Loki query language, is heavily inspired by Prometheus PromQL. However, when it comes to filtering logs and finding the needle in the haystack, the query language is very specific to Loki. In this article we’ll give you all the tips to create fast filter queries that can filter terabytes of data in seconds. In Loki there are three types of filters that you can use.


