Operations | Monitoring | ITSM | DevOps | Cloud

Latest Posts

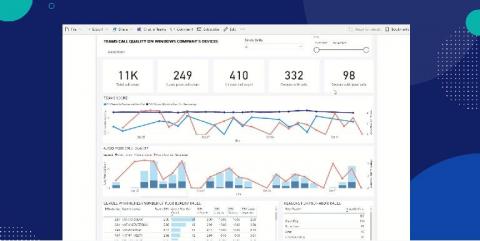
Exploring New Integration Opportunities with Azure Data Lake and Power BI

From digital transformation to infrastructure optimization, business analytics and data visualization allow IT stakeholders to make sense of complex situations. You can’t improve what you can’t measure, right? More and more, we see IT organizations combining different sources of information to uncover unique insight, allowing them to detect areas of improvement, find new opportunities, optimize processes and gain that competitive edge.

Kubernetes 1.20: A Big Release to Celebrate the End of 2020

Each Kubernetes release is driven by the community. The features that are delivered, along with the release cadence, are guided by Kubernetes contributors. This year presented a number of challenges that impacted the community and, as a result, the Kubernetes 1.19 release was prolonged and saw a large focus on stability, both in terms of testing and features delivered. After this prolonged release, there was just enough time to get one more release out for the year!

Deloitte harnesses ServiceNow IT Business Management

As a world leader in professional services, Deloitte knows how to innovate and meet client requirements to a high standard. The professional services network uses ServiceNow IT Business Management and ServiceNow digital workflows to operate efficiently and deliver on client projects. Once Deloitte had achieved initial success with query management, the team began examining opportunities to use ServiceNow to digitise workflows across the organisation.

Splunk Named a Leader in The Forrester Wave: Security Analytics Platforms, Q4 2020

We’re thrilled to share the news that Splunk has been named a Leader in The Forrester Wave™: Security Analytics Platforms, Q4 2020. It’s an honor to be named a Leader by Forrester. We view it as an affirmation of our commitment to customer success and a reflection of our ability to understand their needs. Through close collaboration with our customers, we have developed innovative solutions to protect their data hosted in on-premises, hybrid or multi-cloud environments.

Sponsored Post

The top 13 APM tools in 2020

From increased uptime and improved user experiences to reduced risks and decreased expenses, application performance monitoring provides organizations with several business benefits that enable them to move faster than their competitors and deliver more value to their users. For this reason, it comes as no surprise that the market for application performance monitoring (APM) tools is expected to reach nearly $5 billion in 2020, an impressive uptick from the $2.72 billion the market hauled in during 2014.

Why VPNs on mobile devices are a crucial part of securing access to corporate data

Securing access to business resources has always been of high priority for admins and IT teams. In the wake of the pandemic, workforces are more distributed than ever before, and 76 percent of global office workers state that they would like to work from home even when the pandemic is over.

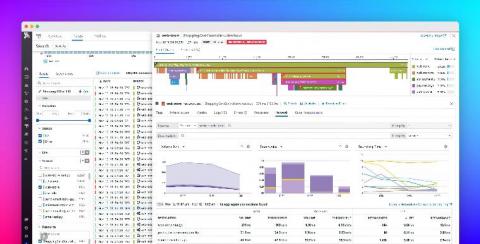
Debug application issues with APM and Network Performance Monitoring

With the advanced containerization that has become the norm in the modern cloud, your infrastructure is likely more distributed, and thus more exposed to networking issues, than ever before. When troubleshooting application performance issues, this can make it difficult to link the symptoms you observe through monitoring the “golden signals” (requests, latency, and errors) on individual endpoints in your application to their underlying root causes.

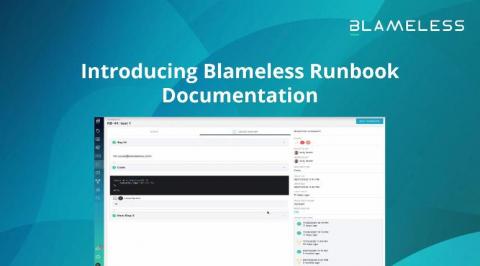
Introducing Blameless Runbook Documentation

At Blameless, our mission is to provide teams with the tools they need to operationalize SRE and embrace a culture of resilience. We help teams automate toil and adopt best practices across integrated incident management, comprehensive retrospectives, service level objectives, reliability insights, and more. We are very excited to announce that teams now have a new tool in their tool belts with our latest launch. Blameless Runbook Documentation is now available for early access.

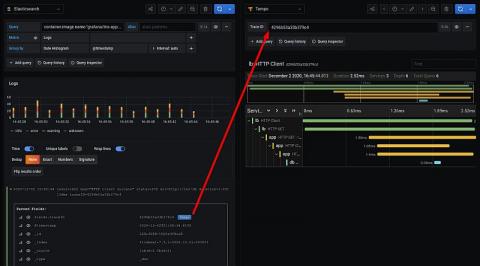
How to find traces in Tempo with Elasticsearch and Grafana

Grafana Tempo, the recently announced distributed tracing backend, relies on integrations with other data sources for trace discovery. Tempo’s job is to store massive amounts of traces, place them in object storage, and retrieve them by ID. Logs and other data sources allow users to quickly and more powerfully jump directly to traces than ever before. Previously we investigated discovering traces with Loki and exemplars.

Support for Database Performance Monitoring in Node

Performance monitoring is great because it lets you see whether your application is fast or slow, and which parts need speeding up. For Node developers, those “parts” are most often endpoints handling incoming requests. Since the introduction of our performance monitoring offering in July 2020, Node devs have been able to use the Sentry SDK, @sentry/node, to measure the total time it takes to process each request, but we made some significant improvements since then.