Operations | Monitoring | ITSM | DevOps | Cloud
Latest Posts
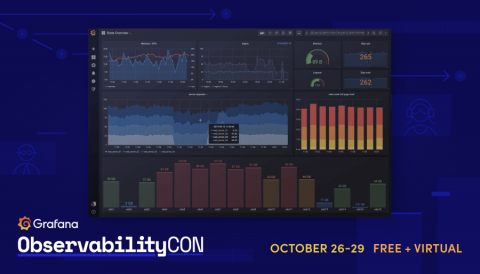
ObservabilityCON Day 3 recap: What's new in Loki 2.0, tracing made easy with Tempo, observability at the Financial Times, and a Minecraft NOC
Today is the last day of ObservabilityCON 2020! We hope you’ve had the chance to catch the talks so far, and will tune in live for today’s sessions. View the full schedule on the event page, and for additional information on viewing, participate in Q&As, and more, check out our quick guide to getting the most out of ObservabilityCON. If you aren’t up-to-date on the presentations so far, here’s a recap of day three of the conference.
Migrating to TimescaleDB
Here at MetricFire we’re moving some huge rocks to get more benefits for our customers. Our tech team is migrating our Graphite backend from a Riak database to TimescaleDB. This will drive huge benefits for our customers stemming from the new ability to access their database through PostgreSQL querying. Simultaneously, we’ll be migrating our cloud provider from Hetzner to AWS. This drives further benefits surrounding latency, uptime and security requirements for our customers.
How to Analyze Logs Using Artificial Intelligence
As your tech stack increases, every new device (network devices, servers, applications) creates a large amount of distributed log data. This forms part of what is called “machine data”, which is growing 50x faster than traditional business data. In fact, everything in your stack is continuously writing new events to your log files, including error logs that contain a record of critical errors encountered by a running application, operating system, or server.
Managed autoscaling for all types of container workloads
A flexible architecture is critical for dynamic containerized applications but managing different infrastructure configurations to support different applications is a heavy lift, requiring significant time and effort. The major cloud providers do offer customers core capabilities to deploy, manage and scale cloud infrastructure through AWS Auto Scaling Groups (ASGs), GCP Instance groups and Azure Scale sets.
Container Orchestration Tools Explained
The way we write, ship, and maintain software today has evolved drastically in the last few years. How we consume underlying infrastructure to run our software has matured significantly, in that we have seen a transition from bare metal to virtual machines to containers to micro-VMs.
Azure Lighthouse jumpstart
We are delighted to have a guest blog from Microsoft MVP Martin Ehrnst! Read on for Martin's expert advice on how best to use Azure Lighthouse. Afterwards, head over here to see how you can get a true single pane of glass for all your Azure tenants using SquaredUp's new Lighthouse features. Azure Lighthouse provides a unified management experience across all your customers (and internal) Azure resources. Depending on your background, you might not know why this is so big.
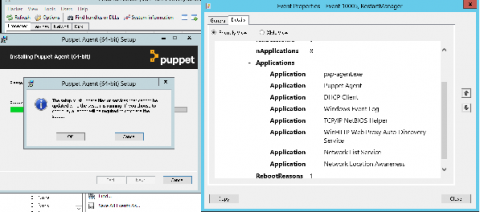
Solving critical Windows services restart during Puppet agent upgrades
In this blog we’ll share the journey we went on to solve a not-so-easy customer problem: a critical Windows services restart during Puppet agent upgrades. As with most software fixes, it starts with a customer ticket: component DHCP Server service restarts after an upgrade. This troubleshooting journey goes from analyzing Windows installer logs, to using undocumented Windows API calls, and back to the Windows installer logs, until we eventually found a solution.
Grafana 7.3 released: Support for the Grafana Tempo tracing system, new color palettes, live updates for dashboard viewers, and more
Grafana v7.3 has been released! With Grafana 7.0, we rounded out our observability story by making tracing a first-class citizen in Grafana alongside metrics and logs. That release included integrations with Jaeger and Zipkin, and earlier this month, we announced our integration with AWS X-Ray. At ObservabilityCON on Monday, we announced Grafana Tempo, our new open source distributed tracing system. Tempo is massively scalable, cost-effective, and easy to operate.
Qovery is now part of the CNCF
Qovery is excited to announce that we are now a silver member of the Cloud Native Computing Foundation (CNCF) and Linux Foundation (LF). As a CNCF silver member, we are looking forward to contributing to CNCF projects and playing an active role in developing the cloud-native ecosystem. Qovery also recently makes is deployment engine open-source, an abstraction layer library that turns easy apps deployment on AWS, GCP, Azure, and other Cloud providers.


