Operations | Monitoring | ITSM | DevOps | Cloud

Latest Posts

The difference between Event Logging and Tracing in Observability

I have been noticing that a lot of folks are often confused between event logging and tracing. In terms of building out a generic SD for devs to report on observability data, should Event APIs be distinct from Trace APIs? Is an Event just a single Trace Span ? If you look at Honeycomb’s implementation, an Event seems to be equivalent to a single span trace. The middleware wrapper creates a Honeycomb event in the request context as a span in the overall trace.

Announcing the Elastic Contributor Program

Open source contributions are foundational to Elastic — from Elasticsearch’s Apache Lucene core to the addition of open source Logstash and Kibana to form the Elastic Stack you’ve come to know and love. Over the years, the Elastic community has created over 90 Beats, shared use case tutorials like those from Volvo, T-Mobile, and Microsoft, and presented at hundreds upon hundreds of meetups.

Bold, insightful, real-time: Visualizing APM data with Canvas in Kibana

Since we launched Canvas in 2018, we have seen tons of our users create beautiful dashboards that tell stories with Elasticsearch data. In the spirit of making it even easier to get started, we are creating templates that you can import and get instantly beautiful dashboards for all the data the Elastic Stack captures.

Your Burning Questions about AIOps and Observability Answered

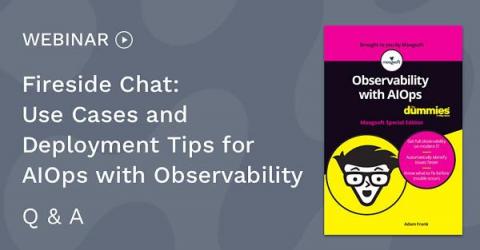
A fireside chat to discuss use cases and deployment tips for AIOps with observability generated a stream of compelling questions from attendees, which the Moogsoft hosts answered with depth and expertise. Combining AIOps analysis with detailed observability data is key for DevOps and SRE teams to attain continuous service assurance, so Moogsoft just published a new ebook about this topic titled “Observability with AIOps For Dummies.”

How to Use the Triple-A Framework to Optimize Your IT Services

Marketing teams have the 4 Ps (product, price, place, and promotion). Sales teams have ABC (Always Be Closing). As far as frameworks go, there are a lot of great examples out there for how we can effectively do our jobs, create processes, and make decisions. But what about IT teams looking to optimize their services? Do any frameworks exist? One does, it’s called the triple-A framework—and it’s got nothing to do with batteries.

How to Avoid SLA-Killing, Budget-Busting Cloud Performance Problems

There are lots of excellent reasons to move applications into the public cloud. But those benefits cannot come at the expense (pun intended) of performance. Your SLAs, whether explicitly stated and written into contracts or implicitly promised through your commitment to quality, are part of your brand. Falling short is costly. Even if you don’t have to pay penalty fees, your reputation and customer loyalty can take a hit.

Nexthink Named in Gartner's Guide for Digital Experience Monitoring (DEM)

We’re proud to announce that Nexthink has been named, once again, as a leading technology vendor in Gartner’s latest Market Guide for Digital Experience Monitoring (DEM). More than ever, the topics in the guide are striking a chord for many Infrastructure & Operations (I&O) leaders. According to Gartner, in the first few months of 2020 inquiries for end-user experience grew five times compared to 2019.

How SIGNL4 solves typical problems in network monitoring

A new article in the September issue of German magazine LANLine (“Automation creates productivity”) summarizes typical challenges and problems in network monitoring very well and is worth reading. I would like to briefly discuss some of the problems addressed and how our product SIGNL4 was developed as a solution for exactly these problems.