Operations | Monitoring | ITSM | DevOps | Cloud

Latest Posts

Introducing Organization Accounts

Several times throughout the last five years of StatusGator, we have received requests for organizational accounts. As more and larger teams have joined, there’s been a steady increase in requests for multi-user accounts. We are proud to announce that StatusGator Organization accounts are now available on our Start Up plan and above. Our first implementation of this is quite simple: separate user accounts are joined together by linking them to a parent Organization record.

What Does 99.9% Uptime Mean?

An old adage about choosing a hosting provider says that everyone promises 99.9% uptime so you need to test uptime of a site for the real picture. Or scour the forums for reviews and judge for yourself how reliable they are. That works too. What that saying is really getting at is the need for some kind of indicator that uptime does not fall below expectations, because you can’t just trust the word of the provider when your business is at stake.

Top metrics to look out for while monitoring Node.js applications

Applications built on the Node.js platform, an event-driven I/O server-side JavaScript environment based on Google Chrome’s V8 engine, are known as Node.js applications. Since both the server-side and the client-side are written in JavaScript, Node.js facilitates easier and faster implementation of codes, and processes requests quickly and simultaneously; this is greatly beneficial for building real-time applications, especially chat and streaming applications.

Elixir Package 1.13: Phoenix LiveView Helpers and Updated Typespecs

With a special thanks to Aleksandar and Unai, we’re happy to announce AppSignal for Elixir 1.13.0, which includes our all-new LiveView instrumentation helpers and updated typespecs. If you’re not an AppSignal user yet, make sure to check out the product tour and see how errors, performance, host metrics and triggers all come together in one tool.

Configuring your Elixir Application at Runtime with Vapor

Configuration has long been a hot topic in the Elixir community, and luckily, in the recent months, there has been a great deal of thoughtful work put into making this problem an easier one to solve. Today, we’re going to show you how to migrate from an Elixir application that has been configured with the widely used config/*.exs files at compile-time, to an application that instead uses environment variables for configuration and is configured at runtime.

Elasticsearch Update Index Settings

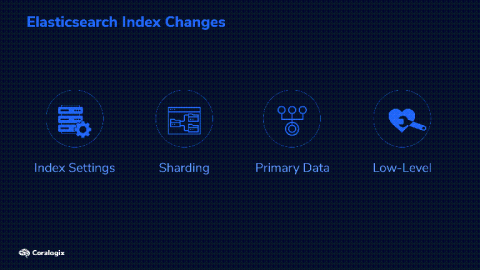
You’ve created the perfect design for your indices and they are happily churning along. However, in the future, you may need to reconsider your initial design and update the Elasticsearch index settings. This might be to improve performance, change sharding settings, adjust for growth and manage ELK costs. Whatever the reason, Elasticsearch is flexible and allows you to change index settings. Let’s learn how to do that!

Monitor, manage, and secure Office 365 remotely

Businesses around the world have been forced to adopt remote working policies in response to the COVID-19 outbreak. In just two months, a vast number of employees around the world shifted to a work-from-home environment. Although some businesses already had many of their IT operations available on the cloud before the pandemic—with the help of cloud-hosted email and collaboration suites such as Office 365—no one expected such a sudden and widespread transition into teleworking.

How AI4ALL is reprogramming remotely for success

In the past two months, companies everywhere have shifted their workforces from office cubicles and conference rooms to home offices and dining room tables. The coronavirus pandemic’s thunderous impact – bolstered by government mandates to maintain social distancing protocols and shut down non-essential workplaces – has forced companies to pivot hard and fast to a new reality, whether they’re ready for it or not.

Tutorial: Logging with journald

If you’re using Linux, I’m sure you bumped into journald: it’s what most distros use by default for system logging. Most applications running as a service will also log to the journal. So how do you make use of these logs to: In this post, we’ll answer all the above and more. We will dive into the following topics: There are lots of other options to centralize journal entries, and lots of tools to help.

Grafana 7.0 sneak peek: New table panel for dashboards

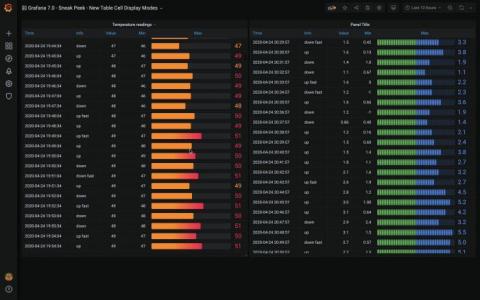
Grafana v7.0 is coming next month! Here’s a sneak peek of one of its features: a brand-new table panel. The current (old) table panel has accumulated a ton of feature requests over the years, and we are excited to finally close many of them in 7.0 with this new table panel. Among the many new things this panel can do is to include other visualizations inside cells. For example, you can configure a cell style (per column) to render the value as a bar gauge.