Operations | Monitoring | ITSM | DevOps | Cloud
Latest Posts
CVE-2019-19394 - Mission Portal JavaScript Injection vulnerability
A vulnerability was recently discovered in CFEngine Mission Portal and has now been fixed. Under certain circumstances, it was possible to inject JavaScript code into data presented in Mission Portal, that would be run in the user’s browser. This security issue was fixed in CFEngine 3.10.7, 3.12.3, and 3.15.0, and will be mitigated by upgrading your hub to one of these versions (or later). No other action is required than upgrading the Hub.
Using observability tools to set SLOs for Kubernetes Applications
Flattened Datatype Mappings - Elasticsearch Tutorial
In this article, we’ll learn about the Elasticsearch flattened datatype which was introduced in order to better handle documents that contain a large or unknown number of fields. The lesson examples were formed within the context of a centralized logging solution, but the same principles generally apply. By default, Elasticsearch maps fields contained in documents automatically as they’re ingested.
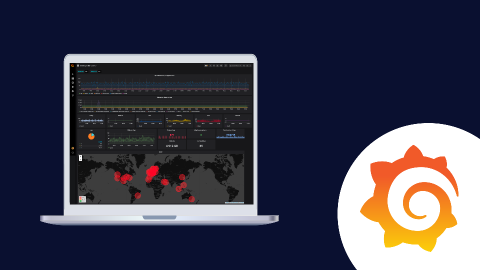
Getting Started with Grafana Dashboards using Coralogix
One of the most common dashboards for metric visualization and alerting is, of course, Grafana. In addition to logs, we use metrics to ensure the stability and operational observability of our product. This document will describe some basic Grafana operations you can perform with the Coralogix-Grafana integration. We will use a generic Coralogix Grafana dashboard that has statistics and information based on logs. It was built to be portable across accounts.
Hardening Windows security: How to secure your organization - Part 2
We’re back with part two of our three-part blog series on living-off-the-land attacks. If you missed part one, you can read it here. In a nutshell, living-off-the-land (LOTL) refers to a type of attack where the attacker uses the tools and features that already exist in the target environment to carry out malicious activities. The concept of LOTL is not new, but LOTL and file-less attacks have been gaining popularity over the last few months.
Azure Functions Live - April 2020
New AppSignal Feature: Graph Builder
Dashboards should be easy to build and provide powerful insights. Our magic dashboards are already created automatically, so you don’t have to spend any time setting up these dashboards yourself. Many developers started tracking custom metrics that were unique to their applications. From these metrics, you can create custom dashboards and add triggers to get notified if values go outside of your desired range.
Impact of COVID 19 on IT Infrastructure & Shift in Priorities
So many aspects of our business & lives are under pressure right now due to the global pandemic. In the middle of all this, IT infrastructure still remains the backbone of the smooth business operations. Motadata is committed to helping individuals like you & your organization to get through these tough times. We are in this together. We can do this together. People in IT are always busy. Now your firefighters are working from home, you would not want to bother them for redundant tasks.
Performing Image Scanning on Admission Controller with OPA
In this post we will talk about using image scanning on admission controller to scan your container images on-demand, right before your workloads are scheduled in the cluster. Ensuring that all the runtime workloads have been scanned and have no serious vulnerabilities is not an easy task. Let’s see how we can block any pod that doesn’t pass the scanning policies before it even runs in your cluster.


