Operations | Monitoring | ITSM | DevOps | Cloud

Latest Posts

OpenShift monitoring tools

In Part 1 of this series, we looked at the key observability data you should track in order to monitor the health and performance of your Red Hat OpenShift environment. Broadly speaking, these include cluster state data, resource usage metrics, and information about cluster activity such as control plane metrics and cluster events. In this post, we’ll cover how to access this information using tools and services that come with a standard OpenShift installation.

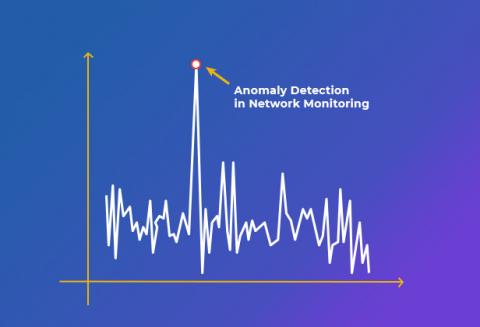
What is Anomaly Detection? It's Role In Network Monitoring

There are some really crucial metrics that are valuable in terms of the insights they offer. Such metrics include user logins, application throughput, network usage and more. Ironically however, some of these metrics are also the ones that are the most variable, having definite valleys and peaks depending on specific times of a week and because of this, it becomes invariably difficult to set up thresholds for analysis and investigation.

Is server monitoring crucial for your business?

While some companies have never experienced a serious outage in services, it's still smart to invest in a monitoring tool for detecting server downtime. In doing so, it's possible to diagnose problems before they spiral out of control. Organizations may first consider free, open-source tools as a cost-effective alternative to paid enterprise versions. However, these free tools require deeper technical understanding to use them efficiently, with regular manual configurations and updates.

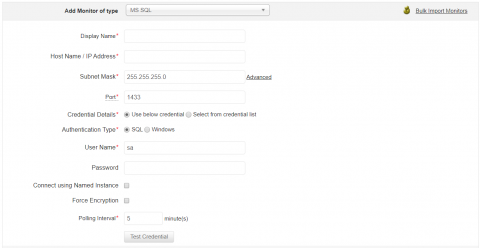
Monitoring MS SQL Server with Applications Manager

MS SQL, Microsoft’s relational database management system (RDBMS), is known for its broad spectrum of capabilities such as transaction processing, business intelligence, and analytics. This is why most businesses trust and invest in SQL for their data storage and access needs. What are the benefits of monitoring SQL servers? Applications Manager offers proactive SQL server monitoring.

COVID-19 sets the stage for cyberattacks: How to protect your business while working remotely

Businesses are shifting their operations to a remote work model in the midst of the COVID-19 lockdown. While this enables business to generally continue as normal, there has also been a rise in cyberattacks because of this shift as reported by national cybersecurity agency CERT-In. Security experts have also predicted a 30-40 percent hike in cyberattacks due to increased remote working.

Loki quick tip: How to use a Loki datasource in your Grafana dashboard

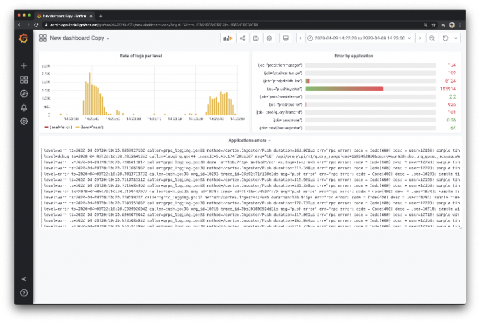
In Grafana, Loki isn’t just for log visualization anymore. Now there’s a simple way to use a Loki datasource as a metric datasource in your graphs. This used to require a hack to make it work – adding Loki as a Prometheus datasource – and the process was very tedious. But Grafana v6.6 integrates Loki even better than before. As a result, right out of the box you can create very nice dashboards about your logs, and mix them with your dashboards about metrics.

Parsing Query Strings in .NET Core

We recently needed to parse and modify some query strings while building Request Metrics. Query string parsing has never been pleasant in .NET, has it improved in .NET Core? We were familiar with HttpUtility.ParseQueryString() for the task, but that API has a major landmine. With the release of .NET Core, Microsoft took another swing at it. We figured we’d try the new way and see how they did! If you want the fully uncensored version, check out the video above.

How to Start Using Counter Caches in Rails

It is widespread to have parent-child associations in Rails applications. On the parent side is a :has_many association, and on the child side is a :belongs_to association. Examples include an article with comments, or an author with books--the former is the parent, and the latter is the child. It is often useful to display a count of the children alongside information about the parent, without necessarily loading all the child records.

Kubeflow: The Answer to AI and ML in Kubernetes?

Kubeflow v1.0 was released on March 2, 2020 Kubeflow and there was much rejoicing. The banner announcement, “Cloud-Native ML for Everyone,” while clearly hyperbole, is evidenced by the streamlined command-line interface (CLI), informative and intuitive dashboard and comprehensive cloud provider documentation. Compounded with a best-in-class product suite supporting each phase in the machine learning (ML) lifecycle, Kubeflow stands unrivaled in the arena of ML standardization.

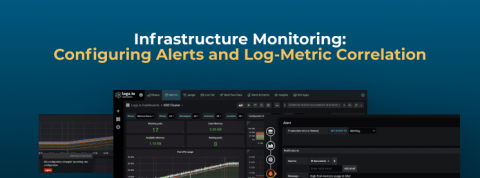
Logz.io Infrastructure Monitoring: Configuring Alerts and Log-Metric Correlation

If you’ve followed our latest blog posts, you’ll have learned how to send metric data to Logz.io and visualize that data on Infrastructure Monitoring – our Grafana-based metrics monitoring solution that we made Generally Available on Monday. At this point you’ll have some nice looking Grafana dashboards in your account.