Operations | Monitoring | ITSM | DevOps | Cloud

Latest Posts

Unlocking the Power of Data: How a Data-Driven Approach Fuels the Path to Autonomic IT

As technology evolves and IT systems become too complex for humans alone to manage, enterprises need to work towards an autonomous business model. This state – known as “Autonomic IT” – unlocks the transformative potential of automation and generative AI to help businesses resolve issues faster, minimize customer interruptions, and drive innovation. However, achieving an Autonomic IT state is not a simple plug-and-play process. It is a gradual evolution, a journey.

Monitoring AWS Lambda Node.js Functions with OpenTelemetry

When deploying a Node.js function in the cloud, you might initially think of traditional methods involving web servers and other infrastructure. However, if your application suddenly faces a surge in traffic—thousands or even millions of requests—it could crash if it's unable to handle the load. This is where AWS Lambda shines. AWS Lambda allows developers to run code without provisioning or managing servers.

20 Technology in the Workplace Statistics, Trends, and Predictions

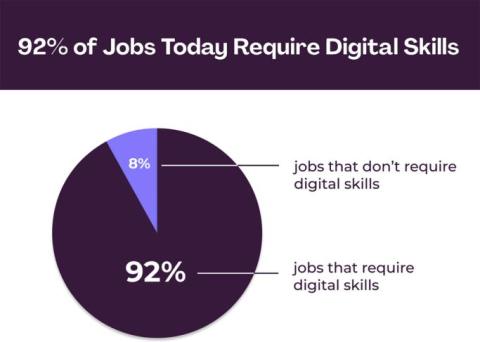
Advanced technologies are reshaping how businesses operate, from facilitating remote work to enhancing employee productivity. By understanding today’s trends, businesses can better prepare for the future of work, optimize their operations, and stay competitive in an increasingly digital world.

"Secret" elmah.io features #5 - Breadcrumbs leading up to errors

It's time for a new post in the series about "secret" elmah.io features. This is the series where I highlight features that some of you may already know while others don't. For today's post, I want to highlight a feature that turns 3 years old this week: Breadcrumbs. Breadcrumbs is a built-in feature in all of our client integrations and the UI. Debugging what went wrong is often a lot easier by providing a logged error with a list of breadcrumbs leading up to an error.

Blue-Green and Canary Releases for Kubernetes

Today I am very happy to announce the general availability of Blue Green and Canary releases for Kubernetes on Cloud 66. Allowing Blue Green and Canary releases for Kubernetes is the result of months of hard work by the team here at Cloud 66 and I am very pleased with the results. We wanted our Blue Green and Canary releases to be simple to use and I think we have found the sweet spot between flexibility and ease of use. Today we are also rolling out Preview deployments to GA for all our customers.

Key findings from The Internet Resilience Report 2024

Ensuring Internet Resilience in today’s digital economy has become not just an IT goal, but a business imperative. Companies are experiencing losses of over $1M a month due to outages and service degradations. Hidden secondary costs include resources dedicated to troubleshooting, payouts to customers, and longer-term impact on company reputation.

OpsRamp Extends Observability to AI Infrastructure

Artificial intelligence is a game-changing technology across industries and business processes, designed to make workers more efficient, reduce the steps it takes to complete a task, and gain answers and insights faster. But those powerful capabilities also put new demands on compute infrastructure and this requires a new class of infrastructure observability metrics.

How OpsRamp's Operations Copilot Will Bring Us One Step Closer to Autonomous IT Operations

As a key part of furthering its autonomous IT operations vision, OpsRamp, a Hewlett Packard Enterprise company, this week announced its new operations copilot feature, a natural-language interface that enables enterprises to identify, predict and solve IT problems more quickly by converting machine data into a human-friendly and actionable form.

Streamline Your Retail Operations with Automated End-of-Day Processing

End-of-day (EOD) processing is a vital routine for retail businesses, encompassing a series of essential tasks that ensure seamless store operations. At the close of each business day, various systems must reconcile transactions, update inventory, process sales data, and generate reports. These activities are crucial for maintaining accurate financial records, optimizing stock levels, and preparing for the next business day.

Translate Datadog metrics into OTLP with the OpenTelemetry Collector and Grafana Alloy

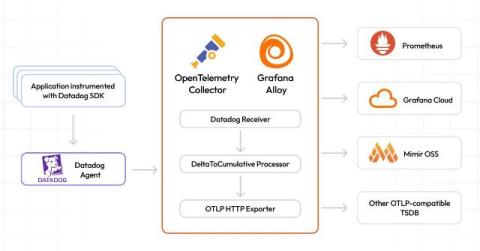
Today, we are excited to announce that we are releasing new code for the OpenTelemetry Datadog receiver as open source. This code allows users to translate Datadog metric formats into native OTLP format. These metrics can then be sent to any OpenTelemetry-compatible metrics system, whether it’s Prometheus, Grafana Mimir, or another backend database.