Operations | Monitoring | ITSM | DevOps | Cloud

Latest News

Lessons learned from running a large gRPC mesh at Datadog

Datadog’s infrastructure comprises hundreds of distributed services, which are constantly discovering other services to network with, exchanging data, streaming events, triggering actions, coordinating distributed transactions involving multiple services, and more. Implementing a networking solution for such a large, complex application comes with its own set of challenges, including scalability, load balancing, fault tolerance, compatibility, and latency.

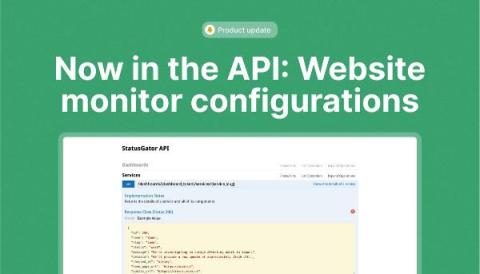
Now in the API: Website monitor configurations

As you may know, StatusGator has two monitor types at present: Cloud service monitors and website monitors. Our website monitor feature allows a myriad of sophisticated configuration options including interval config, HTTP methods, and content or status checks. We’ve just launched some important improvements to our API for those of you using website monitors. Our Service show endpoint will now include configuration details for those monitors that are website monitors under a new key called config.

Checkly adds deep synthetic monitoring to Coralogix with new integration

Starting today, Checkly users can send their traces from synthetics checks to Coralogix to view in-depth synthetic user data along with back-end APM based tracing. This gives SRE’s and Operations engineers a new insight into how the system is responding to automated synthetic tests of your service. For Checkly users, integrating with Coralogix data means it’s easy to correlate end-to-end user experience with backend performance, and track poor performance to its root cause.

How to Fight Alert Fatigue with Synthetic Monitoring: 7 Best Practices

It’s 1am, and something has gone very wrong. The head of sales is in the incident response channel because our top customer is reporting a system-wide outage. Everyone’s running around trying to figure it out. As you look at service maps and traces, you get a sinking feeling. Earlier the previous evening, you got an alert that user-access-service was running out of memory.

Alberto Gomez joins as CPO of Checkly and Tim Nolet will become Chief Evangelist

Today, I’m thrilled to announce two changes to our leadership team. We at Checkly aim to deliver the best synthetic monitoring platform that allows you to identify and resolve issues 10x faster. I’m proud to have crossed that 1,000-customer mark and aim to enhance your experience even further as we are just getting started and are excited about what technologies like Open Telemetry, Clickhouse and others will enable us to do in the future.

Monitor Complex User Flows With Checkly's Multistep Checks

With an ever-growing market of digital products, it is becoming increasingly important for every business to ensure a high level of customer satisfaction. In the past, companies might have been able to get away with slow or messy websites. Today, if a customer gets frustrated even once, they will likely abandon your product in search of a better replacement.

How IT administrators can streamline operations using the LogicMonitor API

In today’s fast-paced IT ecosystem, agility and efficiency are not just goals but necessities. So why waste an hour (or more) manually onboarding individual devices when you can leverage the LogicMonitor API to automate the onboarding process for an entire site in just minutes from a simple CSV file? In this article, we’re going to review how LogicMonitor administrators can maximize efficiency and transform their IT operations using LogicMonitor’s REST API and Powershell.