Operations | Monitoring | ITSM | DevOps | Cloud

Latest News

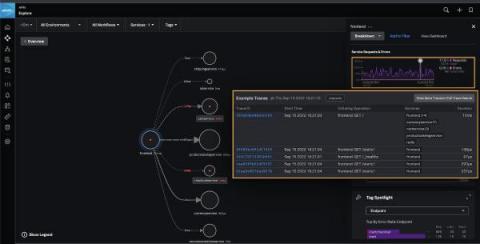
OpenTelemetry, Auto-Instrumentation and Splunk Observability Cloud: A Jump Start

Have you been meaning to learn about OpenTelemetry and the integration of all available application and service telemetry? If you like to learn things by doing; get ready to dive in and have some fun with OpenTelemetry and Splunk Observability Cloud. Quickly learn more about OpenTelemetry auto-instrumentation and collectors at your own pace with these walkthroughs and guides.

Monitoring Cloud Database Costs with OpenTelemetry and Honeycomb

In the last few years, the usage of databases that charge by request, query, or insert—rather than by provisioned compute infrastructure (e.g., CPU, RAM, etc.)—has grown significantly. They’re popular for a lot of the same reasons that serverless compute functions are, as the cost will scale with your usage. No one is using your site? No problem: you’re not charged.

Opentelemetry vs. Prometheus

OpenTelemetry and Prometheus are classified as monitoring tools, but they also have significant differences that your company should know about. For cloud-native applications, OpenTelemetry is the future of instrumentation. It’s the first critical step that allows companies to monitor and improve application performance. OpenTelemetry also supports multiple programming languages and technologies.

How to correlate performance testing and distributed tracing to proactively improve reliability

At ObservabilityCON, we announced our first step towards launching a native integration between Grafana k6 load testing and Grafana Tempo tracing (k6 x Tempo) in Grafana Cloud. We created k6 x Tempo to help dev, testing, and operation teams analyze their performance test results more effectively and proactively improve the reliability of their business-critical applications.

Distributed Tracing: Build vs. Buy

With serverless and containerized applications becoming a norm, workloads and integrations are spread across multiple cloud environments. As these apps become increasingly more distributed, monitoring also becomes more complicated with siloed and incomplete telemetry. This is where distributed tracing brings great value. It enables end-to-end visibility in your modern and complex application.

What is Jaeger Distributed Tracing?

Distributed tracing is the ability to follow a request through a software system from beginning to end. While that may sound trivial, a single request can easily spawn multiple child requests to different microservices with modern distributed architectures. These, in turn, trigger further sub-requests, resulting in a complex web of transactions to service a single originating request.

5-Star OTel: OpenTelemetry Best Practices

Written by Liz Fong-Jones and Phillip Carter. OpenTelemetry, also known as OTel, is a CNCF open standard that enables distributed tracing and metrics collection from your applications. At Honeycomb, we believe that OpenTelemetry is the best way to ingest the high-cardinality and high-dimensional data that every system, no matter how complex or distributed, needs for observability.

Cracking Performance Issues in Microservices with Distributed Tracing

Microservices architecture is the new norm for building products these days. An application made up of hundreds of independent services enables teams to work independently and accelerate development. However, such highly distributed applications are also harder to monitor. When hundreds of services are traversed to satisfy a single request, it becomes difficult to investigate system issues.

Import Datadog Traces Into Honeycomb

Getting existing telemetry into Honeycomb just got easier! With the release of the Datadog APM Receiver, you can send your Datadog traces to the OpenTelemetry Collector, and from there, to any OpenTelemetry-compatible endpoint. Often, evaluating a new tracing solution requires re-instrumenting your applications from the ground up in a new vendor’s tooling. It’s a pretty high bar to clear just to see if a solution is worth adopting.