Operations | Monitoring | ITSM | DevOps | Cloud

Latest News

Using Lumigo OpenTelemetry Distributions with other backends

When we set out to trace applications running outside of AWS Lambda, there was little doubt in our minds that building on top OpenTelemetry was by far the best course of action. There are many reasons for this, but chiefly, it is a question of coverage. At its most fundamental level, achieving coverage requires as-wide-as-possible support for technologies, and interoperability among instrumentations.

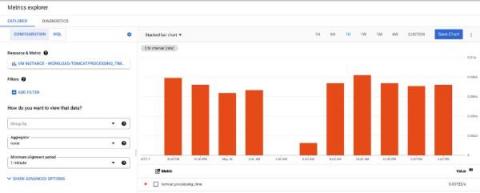
Introducing Logz.io's New Metrics Integration for HashiCorp Consul with OpenTelemetry

HashiCorp Consul began as an open-source project for service discovery. It has evolved to provide other valuable functionality like secure service mesh to help secure microservice architectures based on service identity, but also the ability to achieve repeatable application deployment lifecycles via Network Infrastructure Automation and control access to the service mesh via Consul API Gateway.These features are considered the four core pillars of Consul service networking.

Getting Started with OpenTelemetry: Three Companies Check Into OTel Observability

Comprehensive observability starts with good instrumentation. OpenTelemetry, aka “OTel,” sets a unified standard, enabling you to instrument your applications once, then send that data to any backend observability tool of choice. OpenTelemetry’s standard for generating and ingesting telemetry data is slated to become as ubiquitous as current container orchestration standards. Because of this, development teams are increasingly adopting OpenTelemetry to their applications.

What is Distributed Tracing and How to implement it with Open Source?

Distributed tracing helps you track requests across services and understand issues affecting your application performance. In distributed cloud architecture, debugging performance issues is complicated. Distributed tracing gives visibility to teams on how a user request performs across different services, protocols, and cloud infrastructure. Let’s start with a brief overview of distributed tracing.

How to Reduce Data Costs with OpenTelemetry and BindPlane OP

Data costs fill a large column in many organizations’ accounting sheets. Data pipeline setup and management is a large time sink for DevOps, IT, and SRE. Setting up telemetry pipelines to reduce unwanted data often takes even more time that could better be spent creating value rather than reducing costs. This blog will show you one way to quickly set up your data pipeline to filter unnecessary telemetry data.

The future of OpenTelemetry | Q&A

OpenTelemetry is an open-source project under the Cloud Native Computing Foundation(CNCF) that aims to standardize the generation and collection of telemetry data. The telemetry data helps developer, DevOps and IT teams to keep a check on their application health. The telemetry data collected by OpenTelemetry consist of logs, metrics, and traces. Together, they are used for performance monitoring and observability in distributed systems. At SigNoz, we are building an OpenTelemetry native APM.

Current state of OpenTelemetry and how it fits in the DevOps ecosystem | Q&A

OpenTelemetry is an open-source project under the Cloud Native Computing Foundation(CNCF) that aims to standardize the generation and collection of telemetry data. The telemetry data helps developer, DevOps and IT teams to keep a check on their application health. The telemetry data collected by OpenTelemetry consist of logs, metrics, and traces. Together, they are used for performance monitoring and observability in distributed systems. At SigNoz, we are building an OpenTelemetry native APM.

How to use OpenTelemetry for Kafka Monitoring

Apache Kafka is a high-throughput, low-latency platform for handling real-time data feeds. Its storage layer is in essence a massively scalable pub/sub message queue designed as a distributed transaction log. It can be used to process streams of data in real-time, building up a commit log of changes. Kafka has strong ordering guarantees that enable it to handle all sorts of dataflow patterns including very low latency messaging and efficient multicast publish / subscribe.

Running the OpenTelemetry Collector in Azure Container Apps

In this post, we’ll look at how to host the OpenTelemetry Collector in Azure Container Apps. There are a few gotchas with how it’s deployed, so hopefully this will stop you from hitting the same issues. If you don’t care about the details and just want to run a script, I’ve created one here.

What is Distributed Tracing vs OpenTelemetry?

There are a few key differences between distributed tracing and OpenTelemetry. One is that OpenTelemetry offers a more unified approach to instrumentation, while distributed tracing takes a more granular approach. This means that OpenTelemetry can be less time-consuming to set up, but it doesn’t necessarily offer as much visibility into your system as distributed tracing does.