Operations | Monitoring | ITSM | DevOps | Cloud
Latest News
Serverless Monitoring In The Cloud With The observIQ Distro for OpenTelemetry
The Next Frontier for Observability: Data Ownership with OpenTelemetry
Observability is a mindset that lets you use data to answer questions about business processes. In short, collecting as much data as possible from the components of your business — including applications and key business metrics — then using an AI-powered tool to help consolidate and make sense of this huge volume of data gives you observability into your business. Having observability for your business and applications lets you make smarter decisions, faster.
Tracing vs. Logging: What You Need To Know
Log tracking, trace log, or logging traces… Although these three terms are easy to interchange (the wordplay certainly doesn’t help!), compare tracing vs. logging, and you’ll find they are quite distinct. Logs, traces, and metrics are the three pillars of observability, and they all work together to measure application performance effectively. Let’s first understand what logging is.
Datasets, Traces, and Spans-Oh My!
If you've stumbled (or purposefully landed) on this blog post, chances are you are new to—or diving deeper—into the observability space, o11y for short. Suffice it to say, you’re not in Kansas anymore. Honeycomb in a lot of ways can serve as a yellow brick road into o11y, and this article should serve as an introduction into how Honeycomb facilitates implementing o11y into applications and distributed services.
What is Tracing? Everything You Need to Know
Tracing, or more specifically distributed tracing or distributed request tracing, is the ability to follow a request through a system, joining the dots between all the individual system calls required to service a particular request. Although tracing logs have been around for some time, the trend toward distributed architectures, microservices, and containerization has elevated it from nice-to-have status to an essential piece of the observability puzzle.
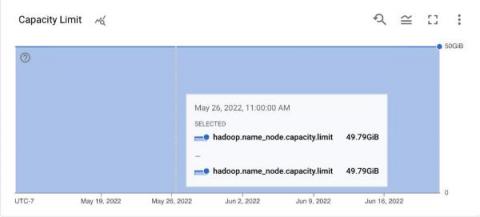
How to monitor Hadoop with OpenTelemetry
How to Collect and Ship Windows Events Logs with OpenTelemetry
How Can OpenTelemetry Enhance Application Performance Monitoring?: A Gartner Quick Answer
Earlier this year Gartner published a report discussing OpenTelemetry and its place in enhancing Application Performance Monitoring (APM).


