Operations | Monitoring | ITSM | DevOps | Cloud
Latest News
Announcing OpenTelemetry Metrics are Now Available as Release Candidates
Splunk is all-in on OpenTelemetry, as exemplified by our native support for it in Observability Cloud, Splunk Enterprise and Enterprise Cloud’s usage of the OpenTelemetry Collector with Splunk Connect for OpenTelemetry Kubernetes, our long-term ambition to use OpenTelemetry as the main way that all Splunk Products capture data from customers’ infrastructure and applications for analysis, and our massive level of contribution to the project.
Ingest OpenTelemetry traces and metrics with the Datadog Agent
OpenTelemetry is a Cloud Native Computing Foundation (CNCF) initiative that provides open, vendor-neutral standards and tools for instrumenting services and applications. Many organizations use OpenTelemetry’s collection of APIs, SDKs, and tools to collect and export observability data from their environment to their preferred backend. As part of our ongoing commitment to OpenTelemetry, we are proud to have contributed our distributed tracing libraries to the CNCF community.
Tracing a Ruby application with OpenTelemetry for performance monitoring
How to Monitor Microsoft IIS with OpenTelemetry
Ask Miss O11y: Not Your Aunt's Tracing
Dear Miss O11y, How is modern observability using tracing, such as Honeycomb, different from the previous distributed tracing software I'm familiar with, like Dapper, at my company? I haven't really been able to wrap my head around Dapper. Does "advanced" observability mean that it's even more complicated than Dapper is? Auntie Alphabet.
Implementing OpenTelemetry in a Rust application for performance monitoring
An introduction to trace sampling with Grafana Tempo and Grafana Agent
Greetings friends, one and all! Over here on the Field Engineering team, we’re often asked about tracing. Two questions that come up frequently: Do I need to sample my traces? and How do I sample my traces? The folks asking are usually using tracing stores where it’s simply not possible to store all of the traces being generated. Those are great questions and the answers depend on a few different factors.
Monitor your Elixir application with OpenTelemetry and SigNoz
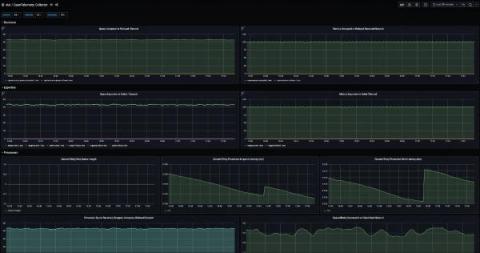
How to collect Prometheus metrics with the OpenTelemetry Collector and Grafana
OpenTelemetry is a set of APIs, SDKs, tooling, and integrations that are designed for the creation and management of telemetry data such as traces, metrics, and logs. One of the main components of OpenTelemetry, or OTel for short, is the OpenTelemetry Collector. The OpenTelemetry Collector, or Otel Collector, is a vendor-agnostic proxy that can receive, process, and export telemetry data.


