Operations | Monitoring | ITSM | DevOps | Cloud

Latest News

What Is Telemetry and Why Is It Important?

Properly leveraging telemetry is a true game-changer for any IT department looking to optimize and stabilize its systems. Telemetry provides the first step to answering the all-important question, “What’s happening in my network?” It’s your eye into the inner workings of your system, giving you a view into how different components are performing.

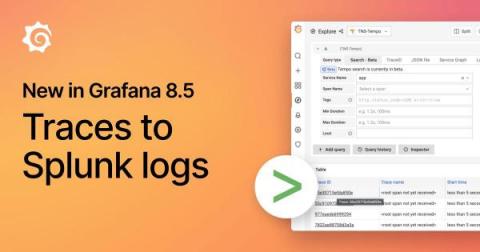
New in Grafana 8.5: How to jump from traces to Splunk logs

The recent release of Grafana 8.5 marks the start of enabling the jump from traces directly to Splunk logs. It’s a big leap that now allows you to draw a straight line between your traces — whether they are coming from Tempo, Zipkin, or Jaeger — to even more third-party logging data, all from the comfort of your traces view. Previously, the Grafana trace to logs enablement included only Loki logs.

Instrumenting Your Custom Application Code with OpenTelemetry

Application Monitoring, or Application Tracing, is an important piece of Observability within your application and stack. Application tracing involves installing an API and/or SDK in your application which then instruments, or wraps your application code with other code that measures the time spent in certain areas of your code, and adds important contextual information to the traces.

How to capture Spring Boot metrics with the OpenTelemetry Java Instrumentation Agent

In a previous blog post, Adam Quan presented a great introduction to setting up observability for a Spring Boot application. For metrics, Adam used the Prometheus Java Client library and showed how to link metrics and traces using exemplars. However, the Prometheus Java Client library is not the only way to get metrics out of a Spring Boot app. One alternative is to use the OpenTelemetry Java instrumentation agent for exposing Spring’s metrics directly in OpenTelemetry format.

Elastic Observability 8.2: Tail-based sampling, plus more serverless visibility for AWS

As more organizations adopt cloud-native technologies and microservices-based architectures, application troubleshooting is becoming increasingly complex. With so many moving parts in an environment that is both dynamic and distributed, it is difficult to get the full picture. Yet complete visibility is crucial in order to find and fix issues quickly — especially ones that impact the bottom line.

How to Monitor Riak Metrics with OpenTelemetry

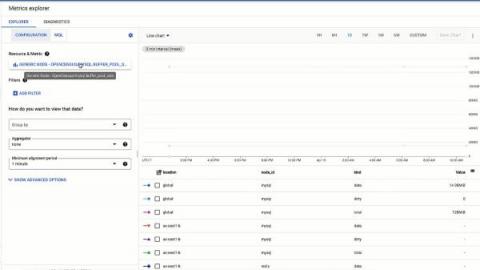
observIQ’s OpenTelemetry members contributed Riak metric monitoring support to OpenTelemetry! You can now monitor your Riak agent performance with OpenTelemetry, and deploy simply with the oIQ OpenTelemetry Collector. You can add the Riak metric receiver to any OpenTelemetry collector. This post demonstrates a configuration for shipping metrics to Google Cloud Operations with OpenTelemetry components.

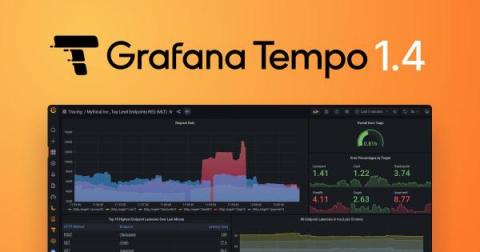
New in Grafana Tempo 1.4: Introducing the metrics generator

Grafana Tempo 1.4 has been released and features a new optional component: metrics generator, which automatically generates RED metrics and service graphs from your traces. We’re actively rolling out the metrics-generator service to our own Grafana Cloud offering and are looking for Grafana Cloud Traces customers wanting early access. If interested, you can email our support team for more details.

Ask Miss O11y: When should you delete instrumentation?

When do you delete instrumentation? You delete instrumentation when you delete code. Other than that, if you’re doing things right: almost never. One of the best things about honeycomb is that it completely transforms the incentives around preserving instrumentation. With metrics-based tools, the most valuable metrics are always custom metrics. You need to define a custom metric for literally any question you might ever want to ask about the app and its utilization or performance.

How to Monitor Redis with OpenTelemetry

We’re excited to announce that we’ve recently contributed Redis monitoring support to the OpenTelemetry collector. You can check it out here! You can utilize this receiver in conjunction with any OTel collector: including the contrib collector, the observIQ’s distribution of the collector, as well as Google’s Ops Agent, as a few examples.