Operations | Monitoring | ITSM | DevOps | Cloud

Latest News

startSpan vs. startActiveSpan

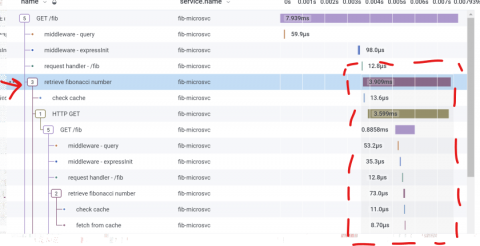
TL;DR: startSpan is easier and measures a duration. Use it if your work won’t create any subspans. startActiveSpan requires that you pass a callback for the work in the span, and then any spans created during that work will be children of this active span. I’m instrumenting a Node.js app with OpenTelemetry, and adding some custom instrumentation. For this important activity that I’m doing (let’s call it “retrieve number”), I’m creating a custom span.

Real-time distributed tracing for .NET Lambda functions

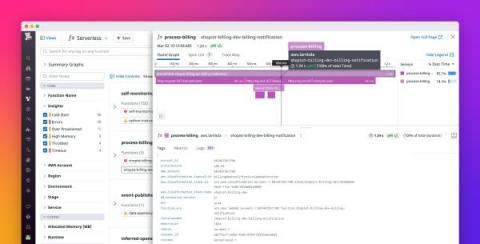
In 2020 we released distributed tracing for AWS Lambda functions written in Python, Node.js, and Ruby, providing you with health and performance insights across your serverless applications. Since then, we’ve expanded our support to additional Lambda runtimes such as Java and Go, and are pleased to announce that real-time distributed tracing is now also available for.NET Lambda functions.

APM is Legacy. Distributed Tracing is Designed for Modern Teams

Some background. Having implemented at least 20 or more APM systems in production as an end-user at various companies, and both deployed and managed countless monitoring tools outside APM, I understand the role of the practitioner. Later on, I shifted to Gartner and led the APM Magic Quadrant for four years, finally spending another four years at AppDynamics (operating under Cisco after two years).

Elastic Observability 8.1: Visibility into AWS Lambda, CI/CD pipelines, and more

Technologies such as serverless computing frameworks and CI/CD automation tools help accelerate software development lifecycles (SDLC) to give development teams a competitive edge in the marketplace. Armed with these technologies, teams can deploy and innovate faster and more frequently by automating repetitive tasks and eliminating the need to manage or provision servers.

OpenTelemetry and Distributed Tracing in JavaScript

In our Configuring OpenTelemetry in Ruby blog post, we showed how to configure OpenTelemetry in a Ruby on Rails backend. In this post, we’ll cover how to configure OpenTelemetry in the front-end JavaScript in order to measure performance of browser and mobile devices and how to configure distributed tracing to work across the frontend and back end telemetry collection. Let’s dive in!

Ask Miss O11y: Making Sense of OpenTelemetry: Who's There? The Resource.

Ah, I too have wondered about this. TL;DR: The Resource says what program is sending these spans and where it’s running. You can skip it if you define OTEL_SERVICE_NAME in the environment. When I’m setting up tracing (for instance, in a Node.js app), I have to create a Resource object in order to set up the OpenTelemetry SDK: If I don’t define that resource parameter, then tracing will still work. But my spans will show up with aservice.name of unknown_service:node.

OpenTelemetry (OTel) Is Key to Avoiding Vendor Lock-in

The promise of OpenTelemetry is that it can help you avoid vendor lock-in by allowing you to instrument your applications once, then send that data to any backend of your choice. This post shows you exactly how to do that with code samples that configure your application to send telemetry data to both Honeycomb and New Relic.

Jaeger Tracing: A Friendly Guide for Beginners

Written by @thetomzach @ Aspecto. In this guide, you’ll learn what Jaeger tracing is, what distributed tracing is, and how to set it up in your system. We’ll go over Jaeger’s UI and touch on advanced concepts such as sampling and deploying in production. You’ll leave this guide knowing how to create spans with OpenTelemetry and send them to Jaeger tracing for visualization. All that, from scratch.

Ask Miss O11y: OpenTelemetry in the Front End: Tracing Across Page Load

Ah, good question! TL;DR: store the start time of the span, and then create the span on the new page. Usually, you want to start a span, do some work, and then end the span. The whole span gets sent to your OpenTelemetry collector (and thence to Honeycomb) when you end it. But when a page load happens, that span object is lost. Honeycomb never hears about it becausespan.end()wasn’t called. How can we deal with this? Create the span only on the new page, where you can end it. But!

Introducing exemplar support in Grafana Cloud, tightly coupling traces to your metrics

We’ve talked in previous posts about why we think the concept of exemplars are so valuable: They make it easy to jump from metrics into exactly the right traces, eliminating the needle in the haystack problem. We were enthusiastic enough about the idea that we helped contribute the necessary code changes to bring this functionality to the Prometheus ecosystem.