Operations | Monitoring | ITSM | DevOps | Cloud

Latest News

Quarterly Product Update: Better Traces, CONCURRENCY, and RATE

At Honeycomb Developer Week, I got an opportunity to walk through a couple of fun new features we’ve shipped since August and ways that we’ve been able to improve Honeycomb for you. Hearing feedback from our users and customers— through support requests, in the Pollinators community, from Twitter, etc.—helps us make Honeycomb better for you.

Flask Application Manual Instrumentation for Distributed Traces

In this blog series, we share the application instrumentation steps for distributed tracing with OpenTelemetry standards across multiple languages. Earlier, we covered Java Application Manual Instrumentation for Distributed Traces, Golang Application Instrumentation for Distributed Traces, Node JS Application for Distributed Traces, and DotNet Application Instrumentation for Distributed Traces. In this blog post, we are going to cover.

Database monitoring with Sumo Logic and OpenTelemetry-powered distributed tracing

We are living in a data world. Data describes and controls almost every aspect of our life, from the president's elections to everyday grocery shopping. Data grows exponentially and so does the complexity of applications that manage that data. We all know the recent shift to microservices and other revolutionary changes that happened in the way we design, develop, deploy and operate modern applications.

Get Started with the Public Beta for Unified Dashboards

During Logz.io’s ScaleUp 2021 user conference, we announced that Unified Dashboards were coming to you soon. And now it’s finally here for anyone to try during the Public Beta. Unified Dashboards will allow Logz.io customers to analyze and filter their logs, metrics, and traces side-by-side on a single monitoring dashboard. Check out our recent blog to learn about why we built Unified Dashboards and the value they bring to customers.

Tracing makes a bug easy to spot

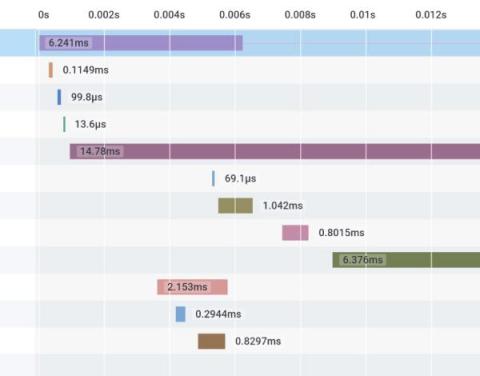
Today, I found a bug before I noticed it. Like, it was subtle, and so I wasn’t quite sure I saw it—maybe I hadn’t hit refresh yet? Later, I looked at the trace of my function and, boom, there was a clear bug. Here’s the function with the bug. It responds to a request to /win by saving a record of the win and returning the total of my winnings so far. Can you spot the problem in the TypeScript? It’s subtle. Now here’s a trace in Honeycomb: Now do you see the bug?

Testing shift left observability with the Grafana Stack, OpenTelemetry, and k6

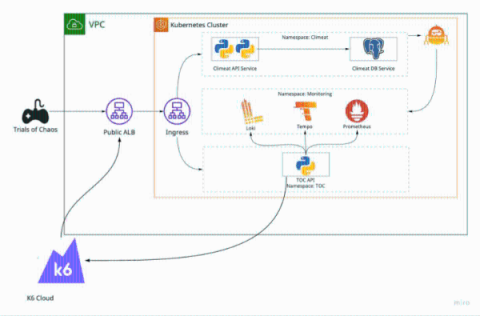
Development is no longer a linear journey from point A to point B. As more projects shift into a state of organic growth, user feedback and constant experimentation are increasingly becoming the norm, if not the standard for engineering. “In order to support this rapid experimentation, we’re beginning to embrace new working methods and practices,” said Vinodh Ravi, Executive Director of Platform Engineering at JPMorgan Chase.

How to Deploy the Splunk OpenTelemetry Collector to Gather Kubernetes Metrics

With Kubernetes emerging as a strong choice for container orchestration for many organizations, monitoring in Kubernetes environments is essential to application performance. Kubernetes allows developers to develop applications using distributed microservices introducing new challenges not present with traditional monolithic environments. Understanding your microservices environment requires understanding how requests traverse between different layers of the stack and across multiple services.

OpenTelemetry Browser Instrumentation

One of the most common questions we get at Honeycomb is “What insights can you get in the browser?” Browser-based code has become orders of magnitude more complex than it used to be. There are many different patterns, and, with the rise of Single Page App frameworks, a lot of the code that is traditionally done in a backend or middle layer is now being pushed up to the browser. Instead, the questions should be: What insights do frontend engineers want?