Operations | Monitoring | ITSM | DevOps | Cloud
Latest News
Jaeger vs New Relic - Key differences, use-cases and alternatives
Jaeger vs OpenTracing - Key differences, use-cases and alternatives
Tracing AWS Lambdas with OpenTelemetry and Elastic Observability
Open Telemetry represents an effort to combine distributed tracing, metrics and logging into a single set of system components and language-specific libraries. Recently, OpenTelemetry became a CNCF incubating project, but it already enjoys quite a significant community and vendor support. OpenTelemetry defines itself as “an observability framework for cloud-native software”, although it should be able to cover more than what we know as “cloud-native software”.
OpenTelemetry tracing - things you need to know before implementing
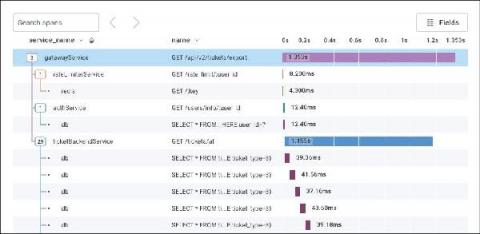
An Introduction to Distributed Tracing
There’s no strict definition of a distributed system. But generally speaking, if you have reached a point where you’re running more than five interdependent services at once, that means you’re running a distributed system. It also means you are more than likely experiencing difficulties when troubleshooting using traditional debugging tools. Unfortunately, pulling up multiple tools, each built for a monolithic world, doesn’t help pinpoint the problem.
Java Application Manual Instrumentation for Distributed Traces
The Stanza Story
We launched the Stanza log agent just over one year ago. Stanza is the result of an uncompromising stance on performance, processing, and configurability for log telemetry. It took mere days for friends and colleagues in the space to raise the obvious objection – there are already so many logging agents, so why spend time on a *new* one? We also heard from competitors who had a snarkier take…
Distributed Tracing for C++ Applications with OpenTelemetry & Logz.io
Many organizations are moving from monolithic to microservices-based architectures. Microservices allow them to improve their agility and provide features more quickly. Although developing a single microservice is simpler, the complexity of the overall system is much greater. Here, we’ll review how to add distributed tracing to C++ with the OpenTelemetry collector and send to Logz.io. One of the biggest challenges is finding efficient tools to quickly debug and solve production problems.


