Operations | Monitoring | ITSM | DevOps | Cloud
Latest News
2 Ways to Integrate the Jaeger App with VMware Tanzu Observability Without Code Changes
In microservices architecture, to identify performance issues—including latency—it’s important to monitor each service and all inter-service communication. Jaeger and VMware Tanzu Observability can help. Jaeger is an open source, distributed tracing system released by Uber Technologies. VMware Tanzu Observability is a high-performance streaming analytics platform that supports 3D observability (e.g., metrics, histograms, and traces/spans).
Monitoring Queues and Resources with Kamon Range Samplers
In this article we discuss the origin story of Kamon’s Range Samplers: what they are, how they work, and how we use them to monitor queues, connection pools and more.
Using Distributed Tracing in Microservices Architecture
From Distributed Tracing to APM: Taking OpenTelemetry & Jaeger Up a Level
It’s no secret that Jaeger and OpenTelemetry are known and loved by the open source community — and for good reason. As part of the Cloud Native Computing Foundation (CNCF), they offer one the most popular open source distributed tracing solutions out there as well as standardization for all telemetry data types.
Adding free and open Elastic APM as part of your Elastic Observability deployment
In a recent post we showed you how to get started with the free and open tier of Elastic Observability. Today we'll walk through what you need to do to expand your deployment so you can start gathering metrics from application performance monitoring (APM), or "tracing" data in your observability cluster, for free.
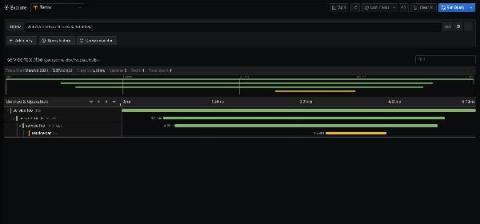
Get started with distributed tracing and Grafana Tempo using foobar, a demo written in Python
Daniel is a Site Reliability Engineer at k6.io. He’s especially interested in observability, distributed systems, and open source. During his free time, he helps maintain Grafana Tempo, an easy-to-use, high-scale distributed tracing backend. Distributed tracing is a way to track the path of requests through the application. It’s especially useful when you’re working on a microservice architecture.
OpenTelemetry Trace 1.0 is now available
For decades, application development and operations teams have struggled with the best way to generate, collect, and analyze telemetry data from systems and apps. In 2010, we discussed our approach to telemetry and tracing in the Dapper papers, which eventually spawned the open-source OpenCensus project, which merged with OpenTracing to become OpenTelemetry.
Announcing support for the AWS managed Lambda Layer for OpenTelemetry
Datadog’s support of OpenTelemetry—a vendor-agnostic, open source set of APIs and libraries for collecting system and application telemetry data—has helped thousands of organizations implement monitoring strategies that complement their existing workflows. Many of our customers leverage OpenTelemetry for their server- and container-based deployments, but also need visibility into the health and performance of their serverless applications running on AWS Lambda.
Logz.io and the AWS Distro for OpenTelemetry
Amazon Web Services has announced enhanced support for the open-source distribution of the OpenTelemetry project for its users. AWS Distro for OpenTelemetry (ADOT) now includes support for AWS Lambda layers for the most popular languages and additional partners integrated into the ADOT collector. And one of those partners is Logz.io! Logz.io is happy to announce that our exporter is now included in the AWS Distro for OpenTelemetry.


