Operations | Monitoring | ITSM | DevOps | Cloud

Latest News

Getting Started with the Splunk Distribution of OpenTelemetry Java

Splunk Distro for OpenTelemetry is a secure, production-ready, Splunk-supported distribution of the OpenTelemetry project and provides multiple installable packages that automatically instruments your Java application to capture and report distributed traces to Splunk APM (no code changes required!), making it easy to get started with distributed tracing!

How to send traces to Grafana Cloud's Tempo service with OpenTelemetry Collector

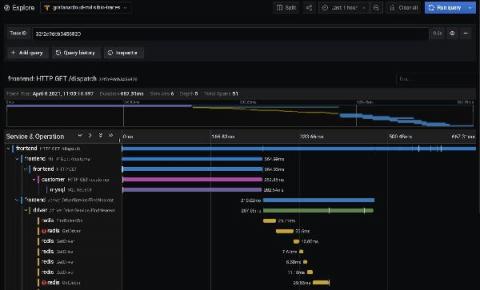
As an open source company, we understand the value of open standards and interoperability. This holds true for Grafana Cloud and our managed Tempo service for traces, which is currently in beta. The Grafana Agent makes it easy to send traces to Grafana Cloud, but it is not required. In fact, Grafana Cloud’s Tempo service is exposed as a standards-compliant gRPC endpoint that conforms to the Open Telemetry TraceService with HTTP Basic authorization.

Logz.io Debuts Multiple Tracing Accounts and Jaeger Architecture Visualization

Logz.io has pressed hard to align our tracing and metrics analytics capabilities over the past year. And as our technology advances, so does our service. We are announcing Multiple Tracing Accounts with Logz.io Distributed Tracing, aligning it with our logging and metrics tools. Complementing multiple data sources for metrics and logs, Logz users can segment their data according to sources and teams for better organization.

Getting Started with OpenTelemetry Python v1.0.0

Since the OpenTelemetry Tracing Specification reached 1.0.0 — guaranteeing long-term stability for the tracing portion of the OpenTelemetry clients, the community has been busy working to get the SDKs and APIs for popular programming language ready to be GA. Next in our ‘Getting Started with OpenTelemetry’ Series, we’ll walk you through instrumenting a Python application and install both the OpenTelemetry API and SDK.

Intro to exemplars, which enable Grafana Tempo's distributed tracing at massive scale

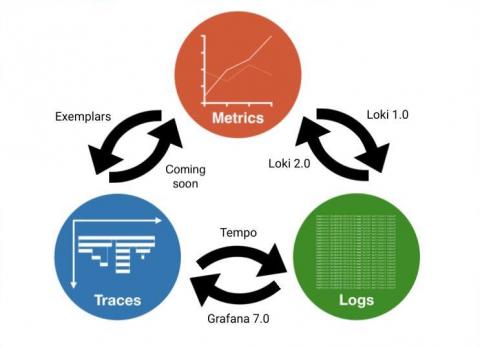
Exemplars are a hot topic in observability recently, and for good reason. Similarly to how Prometheus disrupted the cost structure of storing metrics at scale beginning in 2012 and for real in 2015, and how Grafana Loki disrupted the cost structure of storing logs at scale in 2018, exemplars are doing the same to traces. To understand why, let’s look at both the history of observability in the cloud native ecosystem, and what optimizations exemplars enable.

Uniting Tracing and Logs With OpenTelemetry Span Events

The current landscape of what our customers are dealing with in monitoring and observability can be a bit of a mess. For one thing, there are varying expectations and implementations when it comes to observability data. For another, most customers have to lean on a hodgepodge of tools that might blend open source and proprietary, require extensive onboarding as team members have to learn which tools are used for what, and have a steep learning curve in general.

Getting Started with OpenTelemetry .NET and OpenTelemetry Java v1.0.0

Recently we announced in our blog post, "The OpenTelemetry Tracing Specification Reaches 1.0.0!," that OpenTelemetry tracing specifications reached v1.0.0 — offering long-term stability guarantees for the tracing portion of the OpenTelemetry clients. Today we’re excited to share that the first of the language-specific APIs and SDKs have reached v1.0.0 starting with OpenTelemetry Java and OpenTelemetry .NET.

Trace AWS event-driven serverless applications with Datadog APM

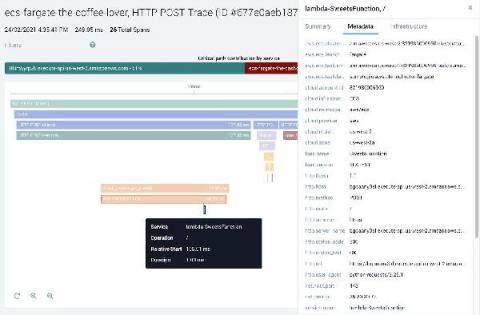
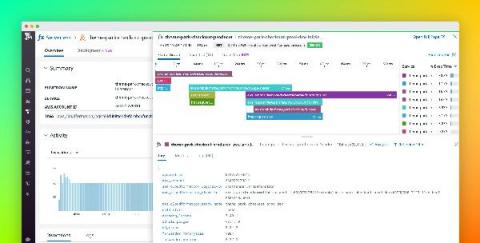
Last year, we released native tracing for AWS Lambda through Datadog APM to provide deep visibility into serverless functions and surface performance issues such as cold starts and errors, without any added latency. But Lambda functions are only one piece of the puzzle in a rapidly growing serverless ecosystem, which includes message queues, data streams, notification services, and more.