Operations | Monitoring | ITSM | DevOps | Cloud

Latest News

My goals as a newly elected OpenTelemetry Governance Committee member

I joined Grafana Labs as a software engineer in October to help build out a team focused on OpenTelemetry, and within a few weeks, I was promptly encouraged to run for a seat on the OpenTelemetry board. Every year, the OpenTelemetry community holds elections for a few seats on the Governance Committee board, which oversees the project at large. The results of this year’s elections are now available, and I am glad to share that I have been elected to serve on the board!

Why Use OpenTelemetry Processors to Change Collected Backend Data

When managing distributed environments, we find ourselves challenged with looking for different ways to understand performance better. Telemetry data is critical for solving such a challenge and helping DevOps and IT groups understand these systems’ behavior and performance. To get the most from telemetry data, it has to be captured and analyzed, then tagged to add relevant context, all while being sure to maintain the security and efficiency of user and business data.

What Is an OTEL Collector?

The primary goal of OpenTelemetry (OTEL) is to offer vendor-neutral ways of application instrumentation such that customers are able to switch between Telemetry backends. There are three main components of OpenTelemetry: OpenTelemetry SDK, OpenTelemetry API, and OpenTelemetry Collector. In this blog, we will be covering the architecture, deployment, and best practices of consuming an OTEL collector.

Instrumentation for C# .NET Apps with OpenTelemetry

OpenTelemetry is the recommended path today for instrumenting applications with tracing in a standard, vendor-agnostic and future-proof way. In fact, OpenTelemetry (nicknamed OTEL) encompasses all three pillars of observability: tracing, metrics, and logs. The tracing element of the specification is now stable with the rest following. This is innovative stuff! You can read more on OpenTelemetry and the current release state on this guide.

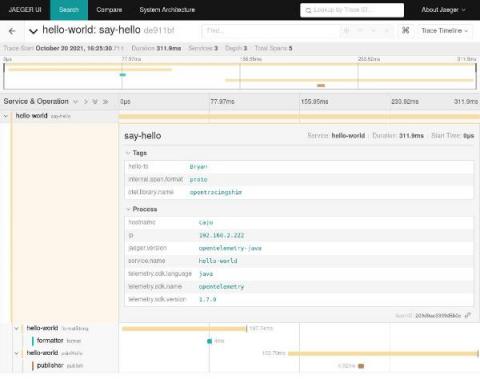
Migrating from Jaeger client to OpenTelemetry SDK

A couple of years ago, the OpenTelemetry project was founded by the merger of two similarly aimed projects: OpenTracing and OpenCensus. One of the goals of this new project was to create an initial version that would “just work” with existing applications instrumented using OpenTracing and OpenCensus.

Auto-Instrumenting Python Apps with OpenTelemetry

In this tutorial, we will go through a working example of a Python application auto-instrumented with OpenTelemetry. To keep things simple, we will create a basic “Hello World” application using Flask, instrument it with OpenTelemetry’s Python client library to generate trace data and send it to an OpenTelemetry Collector. The Collector will then export the trace data to an external distributed tracing analytics tool of our choice.

Vendor Switching With OpenTelemetry (OTel)

You might already know that OpenTelemetry is the future of instrumentation. It’s an open-source and vendor-neutral instrumentation framework that frees you from the trap of using proprietary libraries simply to understand how your code is behaving. Best of all, you can instrument your applications just once and then take that instrumentation to any other backend system of your choice. This blog shows you exactly how to use OpenTelemetry to ✨break the vendor lock-in cycle.✨

The Future of Sumo Logic Observability

I have always found data collection to be a fascinating area of work at Sumo Logic. Collecting data is a critical first step for all the solutions we develop for our customers. After all, to observe the health and performance of your applications, you must first collect all relevant data. It's also an area that has seen some significant activities by the open-source community over the years, which is completely changing the landscape of observability as we know it.

What is OpenTelemetry: A guide to understanding OpenTelemetry and the way forward

OpenTelemetry is a vendor-neutral approach that enables DevOps and developers to collect performance metrics in a standardized manner. Currently a Cloud Native Computing Foundation (CNCF) sandbox project, OpenTelemetry was conceived by merging OpenCensus, Google's open-source method of collecting metrics and traces, and OpenTracing, a vendor-neutral API to collect traces.

What Is Distributed Tracing?

Modern software development is evolving rapidly, and while the latest innovations allow companies to grow through greater efficiency, there is a cost. Modern architectures are incredibly complex, which can make it challenging to diagnose and rectify performance issues. Once these issues affect customer experience, the consequences can be costly. So, what is the solution? Observability — which provides a visible overview of the big picture.