Operations | Monitoring | ITSM | DevOps | Cloud

Latest News

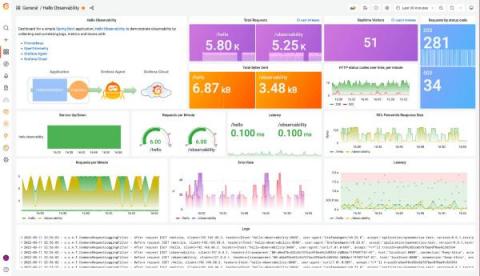
Set up and observe a Spring Boot application with Grafana Cloud, Prometheus, and OpenTelemetry

Spring Boot is a very popular microservice framework that significantly simplifies web application development by providing Java developers with a platform to get started with an auto-configurable, production-grade Spring application. In this blog, we will walk through detailed steps on how you can observe a Spring Boot application, by instrumenting it with Prometheus and OpenTelementry and by collecting and correlating logs, metrics, and traces from the application in Grafana Cloud.

Distributed Tracing Best Practices for Microservices

The management of modern software environments hinges on the three so-called “pillars of observability”: logs, metrics and traces. Each of these data sources provides crucial visibility into applications and the infrastructure hosting them. For many IT operations and site reliability engineering (SRE) teams, two of these pillars — logs and metrics — are familiar enough.

Ask Miss O11y: Baggage in OTel

Miss O11y is delighted to welcome our newest band member: Martin Thwaites! Martin has been a member of the Honeycomb user community practically since its inception. He is a UK-based consultant who specializes in helping teams scale up and tackle challenging business problems, and a long-time contributor to the Azure and.NET communities. We think he looks ✨amazing✨ in a tiara.

New StackPod Episode: OpenTelemetry - the Future of Observability?

OpenTelemetry has been getting a lot of attention in the observability field. Moreover, in StackState’s latest release, we added support for OpenTelemetry traces. Melcom van Eeden, software developer at StackState, was one of our developer champions who made this possible. In addition to joining us on this episode of StackPod, he wrote a blog post on how to leverage OpenTelemetry with StackState and he recorded a tutorial video about the topic.

Ask Miss O11y: Logs vs. Traces

Ah, good question! TL;DR: Trace instead of log. Traces show connection, performance, concurrency, and causality. Logs are the original observability, right? Back in the day, I did all my debugging with `printf.` Sometimes I still write `console.log(“JESS WAS HERE”)` to see that my code ran. That’s instrumentation, technically. What if I emitted a “JESS WAS HERE” span instead? What’s so great about a span in a trace? Yeah, and so do logs in any decent framework.

How to Surface Relevant Performance Data

Your applications most likely consist of multiple components. These components could be written in different languages, with each individually instrumented with Sentry’s SDK. The goal of our tracing solution is to make sure developers get a full picture of the data captured within their tech stack. Tracing allows you to follow a request from the frontend all the way to your backend application and back.

OpenTelemetry Collector - What Is It?

Before we dive into the Collector, let’s cover the components that make up the OpenTelemetry project. If you missed it, our post What is OpenTelemetry gives a high level introduction to OpenTelemetry and the key components of OpenTelemetry project: The OpenTelemetry collector is optional when using a SaaS service like Scout. Even so, knowing what the Collector can do and when to use it is helpful to understand.

OpenTelemetry and Jaeger | Key concepts, features, and differences

OpenTelemetry and Jaeger are both open-source projects under Cloud Native Computing Foundation. In this article, let us understand the key concepts involved in both projects, their features, and their differences. OpenTelemetry is a vendor-agnostic instrumentation library. It provides a set of tools, APIs, and SDKs to create and manage telemetry data(logs, metrics, and traces). Jaeger is an open-source tool focused on distributed tracing of requests in a microservice architecture.

Benefits of Localized Distributed Tracing

Distributed tracing is a household term nowadays – if your house is an IT department! Modern enterprises use cloud-native applications for agility and responsiveness to customer needs. When monitoring cloud-native applications, distributed tracing follows how transactions perform while traversing services or containers in the backend architecture. By definition, we’re describing production applications with requests, methods, database calls and logs that accompany a transaction.