Operations | Monitoring | ITSM | DevOps | Cloud

Latest News

The Leading Tools Compatible With OpenTelemetry

OpenTelemetry (also known as OTel) is a popular open-source framework used to generate telemetry data for traces, metrics, events and logs. In this guide, we are going to cover the best observability and application performance management tools that can be used alongside OpenTelemetry to transform telemetry data into responsive reporting dashboards.

A to Z With Observability and OpenTelemetry

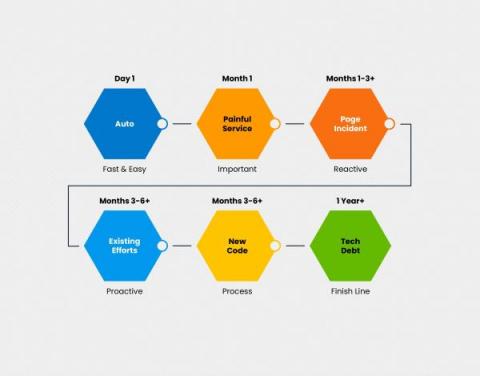
How do you go from A to Z with observability and OpenTelemetry? This post answers a question we hear often: “How do I get started on instrumentation with OpenTelemetry, while also following best practices for the long-term?” This article is all about taking you from A to Z on instrumentation. This will help you: We will use a simple greeting service application written in Node.js to understand the journey. You can find the pre-instrumented state here.

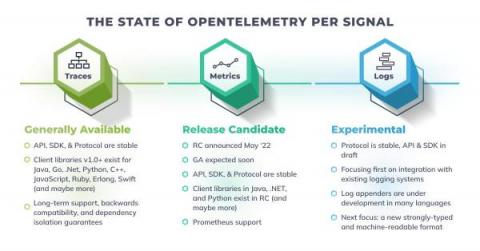
OpenTelemetry Roadmap and Latest Updates

OpenTelemetry is one of the most fascinating and ambitious open source projects of this era. It’s currently the second most active project in the CNCF (the Cloud Native Computing Foundation), with only Kubernetes being more active. I was at KubeCon Europe last month, delivering a talk on OpenTelemetry and it was amazing to see the full house and the excitement and interest around the project.

How to monitor Cassandra using OpenTelemetry

We are constantly working on contributing monitoring support for various sources, the latest in that line is support for Cassandra monitoring using the OpenTelemetry collector. If you are as excited as we are, take a look at the details of this support in OpenTelemetry’s repo. The best part is that this receiver works with any OpenTelemetry collector: including the OpenTelemetry Collector and observIQ’s distribution of the collector.

Tracing Gorm queries with OpenCensus & Google Cloud Tracing

At incident.io we use gorm.io as the ORM library for our Postgres database, it’s a really powerful tool and one I’m very glad for after years of working with hand-rolled SQL in Go & Postgres apps. You may have seen from our other blog posts that we’re heavily invested in tracing, specifically with Google Cloud Tracing via OpenCensus libraries.

Sponsored Post

Transaction Tracking vs Transaction Tracing - What's the Difference?

Transaction tracking and tracing are not the same thing. One of the top 10 banks in the world recently chose Nastel and this was their primary reason. They had a Priority 1 request processor incident on the mainframe where high value messages went missing and it took two weeks to find them. They began by looking at another vendor who said that they did transaction tracking. As the customer said, "They will try to tell you that they do transaction tracking, and that took us a while to drill down." So, let me explain the difference between these terms using an analogy.

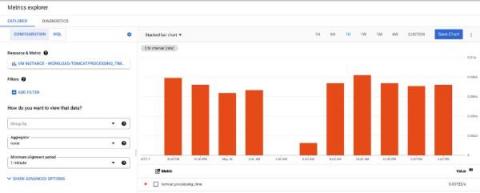
How to monitor Tomcat with OpenTelemetry

We are constantly working on contributing monitoring support for various sources, the latest in that line is support for Tomcat monitoring using the JMX Receiver in the OpenTelemetry collector. If you are as excited as we are, take a look at the details of this support in OpenTelemetry’s repo. You can utilize this receiver in conjunction with any OTel collector: including the OpenTelemetry Collector and observIQ’s distribution of the collector.

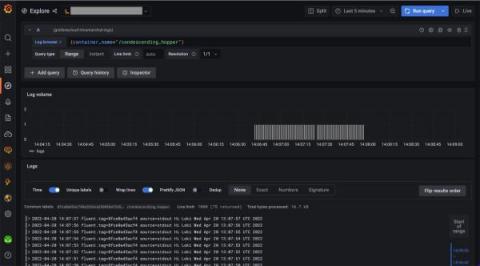
How to send logs to Grafana Loki with the OpenTelemetry Collector using Fluent Forward and Filelog receivers

In this guide, we’ll set up an OpenTelemetry Collector that collects logs and sends them to Grafana Loki running in Grafana Cloud. We will consider two examples for sending logs to Loki via OpenTelemetry Collector. The first one shows how to collect container logs with a Fluent Forward receiver. The second one shows how to collect system logs with a Filelog receiver.

Getting Started with OpenTelemetry for Observability

This article was published in The New Stack. For most developers, software development means there is an API for almost everything, hardware is provisioned via the cloud and the core focus is on building only the features most crucial to your business. Of course, all these integrations and modern distributed architectures create their own set of problems. Having full insight into your application has become even more important and is now commonly known as observability.

Filtering Metrics with the observIQ OpenTelemetry Collector

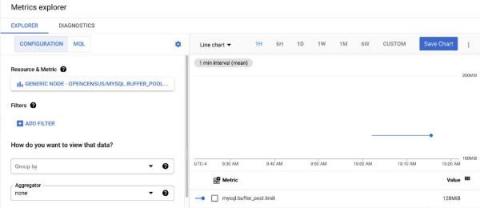
In this post, we will address the common monitoring use case of filtering metrics within the observIQ OpenTelemetry (OTEL) collector. Whether the metrics are deemed unnecessary, or they are filtered for security concerns, the process is fairly straightforward. For our sample environment, we will use MySQL on Red Hat Enterprise Linux 8. The destination exporter will be to Google Cloud Operations, but the process is exporter agnostic.