Operations | Monitoring | ITSM | DevOps | Cloud
Latest News
An Introduction to OpenTelemetry and Observability
Cloud native and microservice architectures bring many advantages in terms of performance, scalability, and reliability, but one thing they can also bring is complexity. Having requests move between services can make debugging much more challenging and many of the past rules for monitoring applications don’t work well. This is made even more difficult by the fact that cloud services are inherently ephemeral, with containers constantly being spun up and spun down.
OpenTelemetry Architecture: Understanding Collectors
Telemetry data is a powerful tool for understanding the behavior of complex systems. OpenTelemetry provides a platform-agnostic, open-source way to collect, process, and store telemetry data. This post explores the OpenTelemetry collector architecture, specifically focusing on the Collectors component. We'll look at how collectors work and how they can be used to process telemetry data from any system or application. We'll also discuss some benefits of using OpenTelemetry for your telemetry needs.
What Are Semantic Conventions in OTEL?
What is OpenTelemetry? What OTEL means for Observability in 2022
Pros and Cons of Installing the OpenTelemetry Collector
The OpenTelemetry Collector is an application written in Go. The GitHub readme does a great job of describing it: So the OpenTelemetry collector is a Go binary that does exactly what its name implies: it collects data and sends it to a back-end. But there’s a lot of functionality that lies in between. What a neat service! A local destination for data that handles the final sending of Open Telemetry information to your back end.
Adding Code Tags to Your OpenTelemetry Spans
In this article, I’m going to walk you through adding attributes to your spans in.NET that contain information about the code that generated the span. We’ll also look at ways to do this automatically using a library I’ve created.
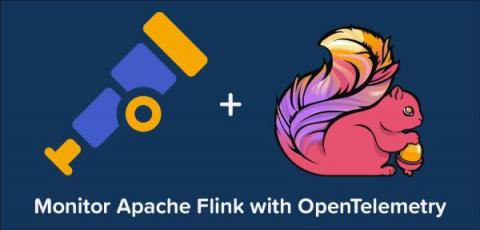
How to monitor Apache Flink with OpenTelemetry
Full Stack Visibility to Find the Root Cause of Slow
An app that works as expected is great, but if expected means a beachball for 10 seconds before the page loads, that’s… not so great. Customers want it all; an application that is stable and fast… Luckily, Sentry does more than tell you when something is broken in your code, it also tells you what’s slow and how to fix it.
4 Killer Coralogix Tracing Features
Tracing is often the last thought in any observability strategy. While engineers prioritize logs and metrics, tracing is truly the hallmark of a mature observability platform, but it is also the most difficult to implement. Once tracing is in place, engineers typically discover something else – many tracing solutions aren’t particularly feature-rich.


