Operations | Monitoring | ITSM | DevOps | Cloud

Latest News

Understand serverless function performance with Cold Start Tracing

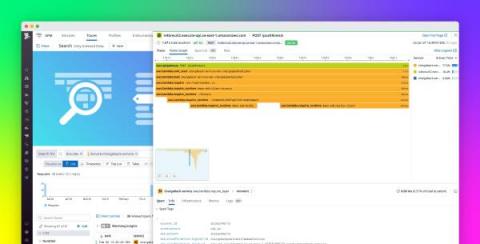
Serverless developers are undoubtedly familiar with the challenge of cold starts, which describe spikes in latency caused by new function containers being initialized in response to increasing traffic. Though cold starts are usually rare in production deployments, it’s still important to understand their causes and how to mitigate their impact on your workload.

Trace-based testing with Elastic APM and Tracetest

This post was originally published on the Tracetest blog. Want to run trace-based tests with Elastic APM? Today is your lucky day. We're happy to announce that Tracetest now integrates with Elastic Observability APM. Check out this hands-on example of how Tracetest works with Elastic Observability APM and OpenTelemetry! Tracetest is a CNCF project aiming to provide a solution for deep integration and system testing by leveraging the rich data in distributed system traces.

Experiment: Migrating OpenTracing-based application in Go to use the OpenTelemetry SDK

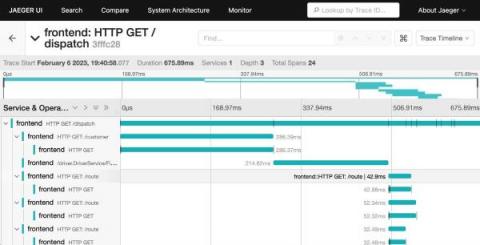
Jaeger’s HotROD demo has been around for a few years. It was written with OpenTracing-based instrumentation, including a couple of OSS libraries for HTTP and gRPC middleware, and used Jaeger’s native SDK for Go, jaeger-client-go. The latter was deprecated in 2022, so we had a choice to either convert all of the HotROD app’s instrumentation to OpenTelemetry, or try the OpenTracing-bridge, which is a required part of every OpenTelemetry API / SDK.

Connecting OpenTelemetry to AWS Fargate

OpenTelemetry is an open-source observability framework that provides a vendor-neutral and language-agnostic way to collect and analyze telemetry data. This tutorial will show you how to integrate OpenTelemetry with Amazon AWS Fargate, a container orchestration service that allows you to run and scale containerized applications without managing the underlying infrastructure.

Get to know TraceQL: A powerful new query language for distributed tracing

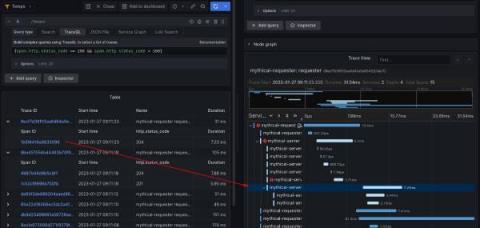
At Grafana Labs, we love tracing, which is why we’ve been hard at work on Grafana Tempo, an open source, highly scalable distributed tracing backend. Tempo just had its 2.0 release. In conjunction with that release, we are excited to show off TraceQL — a powerful new query language designed for distributed tracing. In this blog, we’ll provide an overview of why we created TraceQL, how it works, how you can put it to use today, and what we have planned for future iterations.

Correlate Datadog RUM events with traces from OTel-instrumented applications

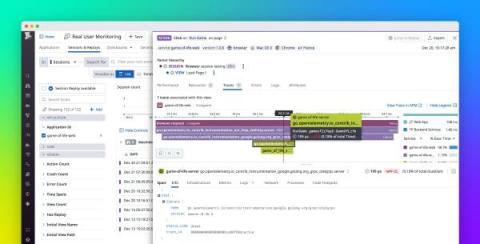
OpenTelemetry (OTel) is an open source, vendor-neutral observability framework that supplies APIs, SDKs, and tools for the instrumentation of cloud-native applications and services. OTel enables you to collect metrics, logs, and traces from a variety of sources and route them to various backends. By itself, however, it can’t help you analyze this data or correlate telemetry from different parts of your stack.

Sponsored Post

Complete observability & monitoring of your integration infrastructure

Integration is a fundamental part of any IT infrastructure. It allows organizations to connect different systems and applications together in order to share data and information. As organizations become more complex and interconnected, they need to ensure they have complete observability and monitoring of their integration architecture. This is essential in order to discover, understand and fix any issues that can arise.

Datadog's commitment to OpenTelemetry and the open source community

The OpenTelemetry (OTel) project is an open source initiative with the goal of providing vendor-neutral standards and tools that enable users to collect telemetry from any source in their environment and send it to any backend. A core tenet of Datadog is to provide a single, unified platform for customers to easily collect and monitor all of their observability data, regardless of where it comes from.

Complete Guide to Distributed Tracing with OpenTelemetry - Part II

In the previous article, we learned what distributed tracing is, why it is necessary, how to do tracing, encountered challenges with existing tracing tools, and finally discovered that there is a more mature option available for the industry to adopt in terms of telemetry and observability. In this article, we will be trying to understand OpenTelemetry in more depth. To begin, we will examine how OpenTelemetry addresses some of the issues confronting the observability ecosystem.

Complete Guide to Distributed Tracing with OpenTelemetry - Part I

Have you heard about traces? Most likely, yes! Do you confuse it with auditing? Hope not. Today, we're going to talk about tracing, specifically “Distributed Tracing,” and do a deep dive into it. Once we’re familiar with distributed tracing, we will show you how to implement it with OpenTelemetry - a new-age observability framework.