Operations | Monitoring | ITSM | DevOps | Cloud

Latest News

OpenTelemetry: Why community and conversation are foundational to this open standard

While many of the popular tools for observability in software are open source, one thing they lack is open design. Most of these solutions, from Nagios to Prometheus, started as a product with an opinionated design, which happened to work well for many people. These became the de facto standards. That position of de facto standard is what every open-source project and every commercial product tries to be.

How to Monitor Cloudflare with OpenTelemetry

With observIQ’s latest contributions to OpenTelemetry, you can now use free open source tools to easily monitor Cloudflare. The easiest way to use the latest OpenTelemetry tools is with observIQ’s distribution of the OpenTelemetry collector. You can find it here. In this blog, the Cloudflare receiver is configured to monitor logs locally with OTLP– you can use the receiver to ship logs to many popular analysis tools, including Google Cloud, New Relic, OTLP, Grafana, and more.

Ship OpenTelemetry Data to Coralogix via Reverse Proxy (Caddy 2)

It is commonplace for organizations to restrict their IT systems from having direct or unsolicited access to external networks or the Internet, with network proxies serving as gatekeepers between an organization’s internal infrastructure and any external network. Network proxies can provide security and infrastructure admins the ability to specify specific points of data egress from their internal networks, often referred to as an egress controller.

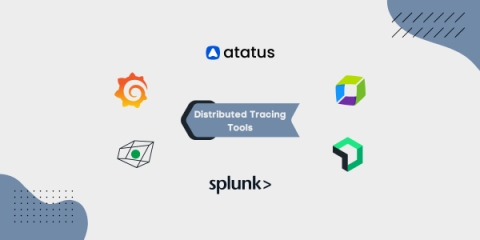
Top Distributed Tracing Tools - Every Developer Should Know

Web applications have expanded over the past ten years to support millions of users and generate terabytes of data. Customers of these programmes anticipate quick responses and round-the-clock accessibility. When businesses adopt service-oriented architectures and give up monolithic workloads, they are stepping into the uncharted ground.

What is Context Propagation in Distributed Tracing?

In modern microservices-based applications, it is difficult to get an overview of how requests are performing across multiple services, infrastructure, and protocols. As companies began moving to distributed systems, they realized they needed a way to track requests in their entirety for debugging applications. Distributed tracing is a technology that was born out of this need.

Integrating OpenTelemetry into a Fluentbit environment using BindPlane OP

Fluentbit is a popular logs and metrics collector used for monitoring anything from virtual machines to containerized applications. With the rise of BindPlane OP and OpenTelemetry, it is not uncommon for organizations to begin replacing Fluentbit, or integrating OpenTelemetry with Fluentbit. An organization may have hundreds or thousands of Fluentbit agents deployed to their endpoints but they want to manage the pipeline using BindPlane OP.

Elastic Observability: Built for open technologies like Kubernetes, OpenTelemetry, Prometheus, Istio, and more

As an operations engineer (SRE, IT Operations, DevOps), managing technology and data sprawl is an ongoing challenge. Cloud Native Computing Foundation (CNCF) projects are helping minimize sprawl and standardize technology and data, from Kubernetes, OpenTelemetry, Prometheus, Istio, and more. Kubernetes and OpenTelemetry are becoming the de facto standard for deploying and monitoring a cloud native application.

Redis Monitoring with OpenTelemetry and SigNoz

In this post, we will show you how to set up Redis monitoring with SigNoz - an open-source full-stack APM. SigNoz captures data using OpenTelemetry, which is becoming the world standard for instrumenting cloud-native applications. Apart from capturing metrics from your Redis server, you can also capture logs and traces with OpenTelemetry.

OpenTelemetry Browser Instrumentation Complete Tutorial

Browser instrumentation refers to collecting and analyzing data about a user's interactions with a web browser. This type of instrumentation involves using specialized tools and techniques to gather information about how a website is being used, such as page load times, network requests, and user interactions. The data collected through browser instrumentation can be used to improve website performance, identify and troubleshoot errors, and gain insights into user behavior.

Deploy Open Telemetry to Kubernetes in 5 minutes

OpenTelemetry is an open-source observability framework that provides a vendor-neutral and language-agnostic way to collect and analyze telemetry data. This tutorial will show you how to integrate OpenTelemetry on Kubernetes, a popular container orchestration platform. Prerequisites.