Operations | Monitoring | ITSM | DevOps | Cloud

Latest News

A Beginner's Guide to OpenTelemetry

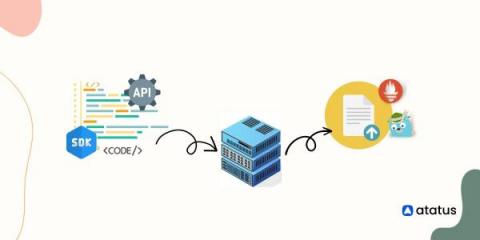
OpenTelemetry (OTel) is an open-source observability framework that provides a standardized way of collecting, processing, and exporting telemetry data (metrics, traces, and logs) from distributed systems. It was born by a merger between two previously separate observability projects, OpenCensus and OpenTracing, and it is currently maintained by the Cloud Native Computing Foundation (CNCF).

The Importance of Azure Distributed Tracing in Integration Services

Distributed Tracing, combined with end-to-end monitoring, lets organizations keep track of their business transactions and receive alerts when anomalies happen. End-to-end monitoring benefits business users and functional administrators more than developers and technical administrators. Nowadays, for developing integration solutions, microservice architectures are becoming the norm. A solution based on such an architecture relies on different services that shape a specific solution together.

Understanding Distributed Tracing with a Message Bus

So you're used to debugging systems using a distributed trace, but your system is about to introduce a message queue—and that will work the same… right? Unfortunately, in a lot of implementations, this isn't the case. In this post, we'll talk about trace propagation (manual and OpenTelemetry), W3C tracing, and also where a trace might start and finish.

How 3 Companies Implemented Distributed Tracing for Better Insight into Their Systems

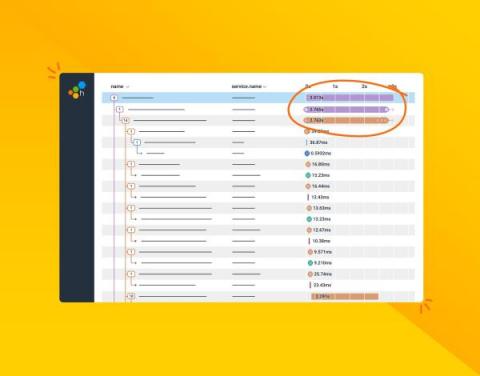
Distributed tracing enables you to monitor and observe requests as they flow through your distributed systems to understand whether these requests are behaving properly. You can compare tiny differences between multiple traces coming through your microservices-based applications every day to pinpoint areas that are affecting performance. As a result, debugging and troubleshooting are simpler and faster.

Implementing Distributed Tracing in a Java application

Monitoring and troubleshooting distributed systems like those built with microservices is challenging. Traditional monitoring tools struggle with distributed systems as they were made for a single component. Distributed tracing solves this problem by tracking a transaction across components. In this article, we will implement distributed tracing for a Java Spring Boot application with three microservices.

Introducing OpenTelemetry Support: Take Action on Your Observability Data

As an open source company that grew out of a side project in 2008 to an application and performance monitoring platform (APM) used by over 3.5 million developers, Sentry is committed to open source and the community of developers maintaining and building in the open. Similarly, we take a public approach to building our software, which is why it’s a natural extension of our values to announce our support for OpenTelemetry (or OTel), the leading open standard for observability.

How to achieve distributed tracing using Application Insights?

In this blog, we will explore how distributed tracing works in Application Insights and how to use it to diagnose the issues in a distributed application. Azure Application Insights is a powerful tool for monitoring and diagnosing application performance issues and supports distributed tracing. It is an extension of Azure Monitor and provides Application Performance Monitoring features out of the box.

OpenTelemetry on AWS, beyond instrumentation and into resource attributes

Instrumenting your code is essential to understanding your system’s performance and diagnosing issues as they arise. Traditionally, this was accomplished using proprietary vendor libraries, causing major lock-in. Enter OpenTelemetry. OpenTelemetry is an open-source project that provides a set of APIs, SDKs, and integrations for instrumenting code.