Operations | Monitoring | ITSM | DevOps | Cloud

Latest News

Protect Your AWS Infrastructure with GuardDuty and Coralogix

Cloud environments like AWS can be a challenge for security monitoring services to operate in since assets tend to dynamically appear and disappear. Making matters more challenging, some asset identifiers that are stable in traditional IT environments like IP addresses are less reliable due to their transient behavior in a cloud service like AWS. Amazon GuardDuty protects your AWS environment with intelligent threat detection and continuous monitoring.

New Feature: Add Custom Metrics For Node.js in AppSignal

You can now monitor any metrics you’d like in your Node.js app with AppSignal. With custom metrics and minutely probes by your side, you’ll now have an excellent overview of your app. If you’ve ever thought “I wish we measured this specific thing so I could monitor better what is going on…”, then this feature is perfect for you.

Proving the Value of IT

There is a value perception gap in IT. It can be a struggle to get past the historical notion that IT is a cost center, rather than a strategic arm of the business. E&Y recently surveyed 300 senior IT professionals around the globe to understand how they are perceived by their C-level executives. The survey found that 67% of CIOs engage with executive peers on matters of budgetary issues and infrastructure management. Far fewer, only 36%, engage in matters of business performance and challenges.

Simplify your IT service delivery with Motadata ServiceOps

Traditionally, IT service management was limited to legacy platforms and infrastructure. Due to a lack of process, interacting with IT teams was frustrating and difficult, resulting in the workforce becoming less engaged, and the gap between the IT team and business growing even further. Since IT service management was already a complicated task for most IT teams, COVID-19 only exacerbated the repercussions.

Netdata Agent v1.23: Kubernetes monitoring & eBPF observability

Deploying and monitoring performance for an entire Kubernetes cluster can be complex. To simplify the process, we’ve added service discovery functionality to eliminate complex configuration, in addition to more advanced monitoring for viewing activity inside containers. Service discovery identifies k8s pods running on a cluster and immediately starts monitoring system performance. All containers are identified, regardless of complexity.

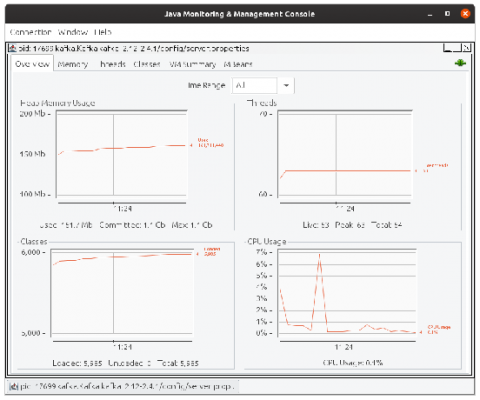
Monitoring Java applications with the Prometheus JMX exporter and Grafana

We all know that Prometheus is a popular system for collecting and querying metrics, especially in the cloud native world of Kubernetes and ephemeral instances. But people forget that Java has been running enterprise software since 1995, while Prometheus is a relative newcomer to the scene. It was only created in 2012! Even though Java has had its own metric collectors since before Prometheus was born, none of our new environments speak its (metric) language. How can you bridge that gap?

Dogfooding Chronicles: Thinking Backward, Moving Forward

Zac Propersi, Engineering Manager at Sentry, can tell when a page is not loading as fast as it should — just by looking at it. While working on our new Metric Alerts feature, Zac noticed that the alerts pages were rendering slowly. Being the super Sentry user that he is, he wrote a custom query in Discover to see just how slow the transactions were.

How to Enable PHP Error Reporting

Errors are undesirable for users and you should do everything in your control to keep users away from them. However, they are of utmost importance for developers. They allow developers to understand the inaccuracies and vulnerabilities in their code by alerting them when their code breaks. They also provide relevant information about what went wrong, where, and what can be done to make amends.

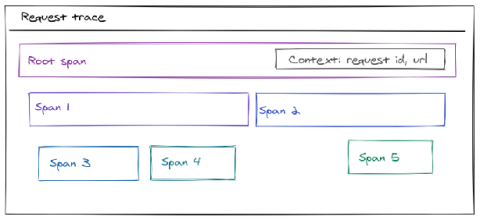
OpenTracing for Go projects

Large-scale cloud applications are usually built using interconnected services that can be rather hard to troubleshoot. When a service is scaled, simple logging doesn’t cut it anymore and a more in-depth view into system’s flow is required. That’s where distributed tracing comes into play; it allows developers and SREs to get a detailed view of a request as it travels through the system of services.

Hooray, We're Cool! At least according to Gartner :)

We’re thrilled to announce that Gartner has named Lumigo a cool vendor in its recent Cool Vendors in Performance Analysis for Cloud-Native Architectures report by Padraig Byrne, Josh Chessman, Federico De Silva, Pankaj Prasad, Charley Rich, published May 18, 2020. The report explains something we at Lumigo heartily agree with: in a cloud-first world, the lines between development and operations are blurring.