Operations | Monitoring | ITSM | DevOps | Cloud
Latest News
How to visualize Prometheus histograms in Grafana
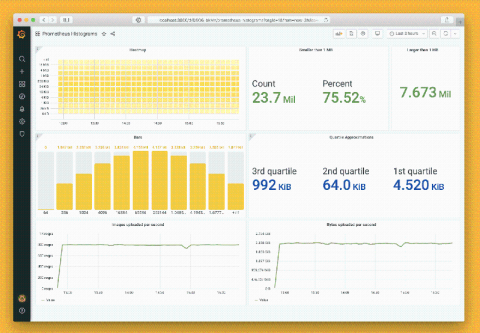
Do you have a Prometheus histogram and have you asked yourself how to visualize that histogram in Grafana? You’re not alone. Here, we will show you how it’s done. This post assumes you already have a basic understanding of Prometheus and Grafana and it will look at Prometheus histograms from the perspective of Grafana 7.0.
Shifting Left: The IT Impact of COVID-19 By the Numbers
On the first episode of the Shifting Left podcast, we talk through the surprising data revealed by a survey of 1,000 IT leaders around the world.
DNS Monitoring 101: Verify DNS Mapping
This Tip of the Day is the first in a three-part series on Domain Name System (DNS) monitoring. The Domain Name System is often described as “the phonebook of the Internet.” While humans access the Internet via domain names such as npr.org or bbc.com, web browsers interact via Internet Protocol (IP) addresses. DNS translates domain names to IP addresses so that browsers know which Internet resources to load.
A Next Step Beyond Test Driven Development
The most successful software development movement of my lifetime is probably test-driven development or TDD. With TDD, requirements are turned into very specific test cases, then the code is improved so the tests pass. You know it, you probably use it; and this practice has helped our entire industry level up at code quality. But it’s time to take a step beyond TDD in order to write better software that actually runs well in production. That step is observability driven development.
Splunk Ranked #1 in Market Share for IDC's Worldwide IT Operations Management Software Market Shares, 2019
We’re excited to announce that Splunk has been named the leader for both market revenue and market share in IDC’s Worldwide IT Operations Management Software Market Shares, 2019 report, having captured 13% of the overall ITOM market and achieving 32.3% year-over-year growth*. We believe this recognition speaks to the continued success of our customers, and we are so thankful for the opportunity to be a part of that success.
Kubernetes observability tutorial: Log monitoring and analysis
Kubernetes has emerged the de facto container orchestration technology, and an integral technology in the cloud native movement. Cloud native brings speed, elasticity, and agility to software development, but also increases the complexity — with hundreds of microservices on thousands (or millions) of containers, running in ephemeral and disposable pods. Monitoring such a complex, distributed, transient system is challenging, and at the same time very critical.
Kubernetes observability tutorial: K8s cluster setup and demo app deployment
The easiest way to get the Elastic Stack up and running for this tutorial, is to spin up a 14-day free trial of our Elasticsearch Service on Elastic Cloud. A few clicks (no credit cards) and you’ll have your cluster up and running. Or if you prefer, download the Elastic Stack and install locally. All of the instructions in this tutorial can be easily amended to work with a standalone Elasticsearch cluster on your own hardware.
3 Reasons to Use Auvik's Remote Management Features
Enterprises that halted IT cloud migrations have been hit with 2.5x outages during global pandemic, new research highlights
Survey respondents who continued their cloud journey experienced less IT performance issues—Virtana and Enterprise Management Associates (EMA) to present full survey findings during June 25th webinar


