Operations | Monitoring | ITSM | DevOps | Cloud
Latest News
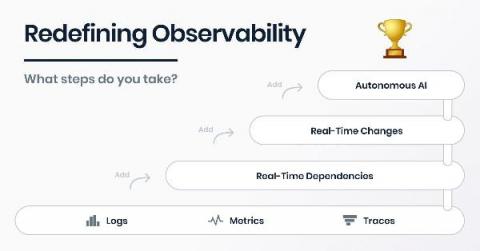
Observability Redefined: 3 steps to improve your IT infrastructure
Are you already applying IT observability to keep up with rapid changes in your IT operations landscape? Currently, the fast adoption of new infrastructures, including hybrid clouds, containers, and microservices, challenges the market. As organizations move towards these highly dynamic architectures, the requirements for traditional IT monitoring change dramatically. More data keeps on coming, and having the time and skill to keep up with this ongoing stream seems to get harder and harder.
API Management Trends 2020
APIs revolutionized the digital landscape by introducing a new level of programming flexibility and ease of integration. Organizations turned to APIs to push innovation and creating an API economy. It was a key driver in the eCommerce industry, businesses like eBay leveraged APIs to generate additional revenue. eBay introduced APIs twenty years ago providing developers a platform to build applications that improved businesses. Today, eBay’s APIs generate over a billion dollars in business.
Living Life at the Edge - An Interview with Dmitriy Akulov
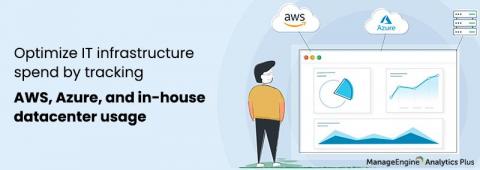
Infrastructure dashboards: Declutter your monitoring data and ensure you're not overspending
The task of monitoring and managing an entire network, including all the servers and applications that run on it, is by no means easy. With so many components of varying complexity, the volume of performance data coming at you can be overwhelming. This information overload increases the chances of missing data that could help discover performance inefficiencies.
How to Use Monitoring Tools to Improve Root Cause Analysis
As an IT manager you would have often heard from your line manager or user ask “Let’s drill down to find the root cause.”? As dreaded a question as it may seem, it is really the most important answer to understand IT outages. IT infrastructure availability is highly dependent on isolating problems, so the deciding variable in a problem can be fixed without putting the entire system at a halt. This is where RCA can be of tremendous help.
Better Python Decorators with Wrapt
Our instrumentation uses built-in extension mechanisms where possible, such as Django’s database instrumentation. But often libraries have no such mechanisms, so we resort to wrapping third party libraries’ functions with our own decorators. For example, we instrument jinja2 ’s Template.render() function with a decorator to measure template rendering time. We value the correctness of our instrumentation a lot so that we do not affect our users’ applications.
What is a Network Audit and How can Uptime.com Help?
Scaling sort of sneaks up on you, doesn’t it? One day, you’re carefree, the next you start to notice something is off… Maybe it’s the crashing, or the frequent dips in performance. Could it be the new hire? It’s not DNS. Is it DNS? Scaling is a natural part of the business process, and your infrastructure will start to change completely as your userbase doubles and triples.
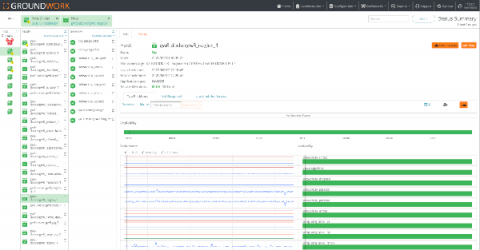
Docker Container Monitoring with GroundWork Cloud Hub
Container technologies have captivated the computing world. Containers are the cornerstone for cloud computing and microservice architectures. Whether it be Docker™, Docker Compose™, or Kubernetes™, the IT world is embracing this technology with great enthusiasm. How can you monitor containers? They are different from traditional hosts and servers. For one thing, they are not physical machines; nor are they virtual machines.
10 Key Performance Indicators to Consider When Monitoring Server Performance
IT applications are vital for today’s digital economy and for the business to succeed, these applications must be highly available and performing well. Application performance degradations can occur for several reasons. There may be code-level issues, database slowness, or network bandwidth constraints. IT applications run on servers and if the server is not sized correctly or is under-performing, application performance will degrade as well.


