Operations | Monitoring | ITSM | DevOps | Cloud
Latest News
DNS Blacklist Monitoring: Protect Your Company's Reputation
Did you know that around 306 billion emails have been sent globally every day in 2020 and about 45 percent of all emails received are spam. Even more surprisingly, websites that are marked as spam on email portals lose 95 percent of their traffic. Email servers tend to blacklist certain IDs as spam based on their content. And for companies marketing their business via emails, 36 percent of the total spam messages across the globe are attributed to advertising content.
The Importance of Monitoring SSL Certificates
Secure Sockets Layer, or SSL, is a global security standard technology that is being adopted by a number of different organizations across the globe. Essentially, SSLs are small data files containing a cryptographic key. This key carries important information about the organization using it. Around 600,000 websites have installed SSL certificates for security.
3 ways secrets management improves monitoring & observability
Monitoring — by its very nature — requires privileged access to internal and external services. In order to safely maintain visibility into critical systems, it’s vital to have some form of secrets management to manage authentication credentials (AKA, "secrets"), including passwords, keys, APIs, tokens, and any other sensitive pieces of information in your IT infrastructure.
Building a Metrics & Alerts as a Service (MaaS) Monitoring Solution Using the InfluxDB Stack
The larger an enterprise becomes, the more systems and applications there are to monitor, and the more scalable its monitoring system has to be to keep up with business growth. This is the challenge that RingCentral — which provides cloud-based communications and collaboration solutions for businesses — faced and solved.
Minimize business losses by monitoring your applications' performance
Downtime is the biggest nightmare for organizations that capitalize on technology. A study about enterprise outages found that nearly 96 percent of enterprises had faced downtime in the past three years. Businesses lose a minimum of $1.55 million annually and 545 hours of staff time due to IT downtime. Up to 51 percent of downtime is preventable, which means businesses are spending on damage control when these resources could be diverted to something more fruitful, like R&D.
Best Practices for Background Jobs in Elixir
Erlang & Elixir are ready for asynchronous work right off the bat. Generally speaking, background job systems aren’t needed as much as in other ecosystems but they still have their place for particular use cases. This post goes through a few best practices I often try to think of in advance when writing background jobs, so that I don’t hit some of the pain points that have hurt me multiple times in the past.
A beginner's guide to monitoring desktop applications
Desktop applications are self-contained programs that operate without any external hosting software. While a web application typically requires a web server to translate the program into HTML content for the web browser to consume, desktop applications deliver the service directly to end-users. We use a number of desktop applications day to day, like conferencing tools, stock management software, source control desktop applications like GIT and Tortoise, photo editing tools, and so on.
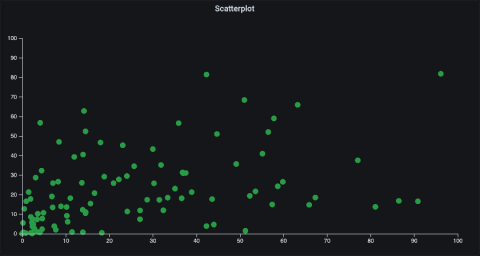
Learn Grafana: How to build a scatter plot plugin in Grafana 7.0
There are a lot of great things about Grafana 7.0, but one of my favorite features is the new React-based plugin platform, which has a set of new APIs and design system to help you build your own plugin. The process is easier and faster than ever. In this blog post, I’ll show how you can create a panel plugin for visualizing scatter plots. A scatter plot is a type of graph that displays values for (usually) two variables as a set of points along a horizontal and vertical axis.
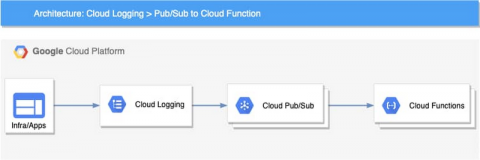
Detecting and responding to Cloud Logging events in real-time
Logging is a critical component of your cloud infrastructure and provides valuable insight into the performance of your systems and applications. On Google Cloud, Cloud Logging is a service that allows you to store, search, monitor, and alert on log data and events from your Google Cloud Platform (GCP) infrastructure services and your applications. You can view and analyze log data in real time via Logs Viewer, command line or Cloud SDK.


