Operations | Monitoring | ITSM | DevOps | Cloud

Latest News

Troubleshooting Encoding Errors in Ruby

Text encoding is fundamental to programming. Web sites, user data, and even the code we write are all text. When encoding breaks, it can feel like the floor is falling out from under you. You're cast into a dimension of bitmasks and codepoints. Logs and backtraces are useless. You consider trading your text editor for a hex editor. But there's hope! In this article, Jose Manuél will show us how encoding errors happen, how they're expressed in Ruby, and how to troubleshoot them.

The Evolution of Open Source Observability

On May 27, the first OpenObservability Conference was held to bring together leaders, practitioners, and users of leading open source observability tools for sessions on the experiences, strategies, and future of the industry. For the Logz.io team, as long-time proponents of open source, it was rewarding to see everyone come together to explore the challenges and opportunities of open source observability.

Catchpoint's SRE Report 2020 - The Highlights

Our 2020 SRE Report is ready! We launched the SRE survey 2020 this January with the goal of understanding the current state of SRE. The survey covered a range of topics including: As we neared the end of the survey period, the SRE community was in the midst of a sudden change. SRE teams were forced to migrate to all-remote IT. We realized we would not be able to provide an accurate analysis without considering this shift in how SRE teams were operating in this new environment.

Using Command Endpoint to execute Checks on Agents

Getting started using Icinga in a single node setup can already be quite a challenge for new users. Configuring checks on multiple nodes can seem at lot harder. With this blog post I will show you how easy it is to configure hosts and services in such an environment. In this example our cluster will consist of one master and two agents and we will use the command endpoint method to execute checks on our agents.

Multi-Cloud Monitoring with OpsRamp

In the first quarter of 2020, enterprises spent $29 billion on public cloud infrastructure, an increase of 37% over the previous year. While the global economy was battered by the coronavirus pandemic, organizations still rushed to accelerate digital transformation and ensure business continuity with hyperscale infrastructure.

How to Monitor your Modbus Devices with InfluxDB

We released a new Modbus input plugin in Telegraf 1.14 and in this blog I’d like to tell you more about that plugin and how you can use it. Modbus is a messaging protocol for industrial devices that was developed by Modicon (now Schneider Electric) for main-secondary communication between these intelligent devices. It has become an ideal protocol for remote terminal units (RTUs) where wireless communication is necessary.

Featured Post

Applying Observability - In Conversation with Nitzan Shapira of Epsagon

Today we hear from Nitzan Shapira, Epsagon CEO, about the latest exciting Epsagon product announcements, how Applied Observability is needed to make sense of ever more complex applications and environments, and how the role of Ops and Monitoring is evolving as part of the new "Cloud 2.0".

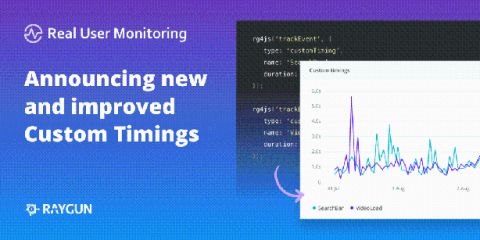
Track any web performance metric with improved custom timings for Real User Monitoring

Over the past few years, we’ve witnessed a couple of key trends in the performance monitoring space. Adoption of single-page applications (SPAs) has continued to grow and as such performance monitoring is evolving. SPAs don’t offer the same existing web metrics like load time or first paint from the browser performance API. As a result, developers require more flexibility to track the metrics that matter to their end-users and business.

Uptrends and your CI/CD processes

If you’ve been following along, the last two articles explained the CI/CD (Continuous Integration/Continuous Delivery) processes. In this article, we look at how Uptrends fits into those processes. Uptrends can fit into your CI/CD process in several different ways. For example, you may want to use Uptrends for the testing and monitoring portions, include your monitor updates as part of your automation processes, or both.