Operations | Monitoring | ITSM | DevOps | Cloud

Latest News

The Cost of Building an In-House Monitoring Solution for Metrics

Computing environments are constantly changing. Back when an on-premises server hosted your work, your infrastructure and applications were easy to track. Now that you’re developing in the cloud, things are more challenging. You’re learning that each team within your organization uses a different monitoring tool. At this point, you may be wondering if it’s time to build your own monitoring solution with open source tools at its core that everyone can use.

April 2020 Outage Report

We will always remember April 2020 as the month that a DDoS attack took the world’s most expensive bottle of whiskey offline. We barely knew ye. Dateline: April 2020, the world’s most expensive whiskey auction is taken offline by DDoS. But other notable outages taught us a lot about which threats dominate our landscape. Namely DDoS attacks, which are highlighting vulnerabilities organizations have with redundancy and threat mitigation.

GrafanaCONline Days 3 & 4 recap: All about Grafana v7.0, the future of Prometheus, and the observability tools every company needs

GrafanaCONline is live! We hope you’re able to catch the great online sessions we have planned over the next couple of weeks. If you haven’t had a chance to tune in lately, here’s what you missed on days 3 and 4 of the conference.

Using Mnesia in an Elixir Application

In today’s post, we’ll learn about Mnesia, see when you would use such a tool, and take a look at some of the pros and cons of using it. After covering the fundamentals of Mnesia, we’ll dive right into a sample application where we’ll build an Elixir application that uses Mnesia as its database. Let’s jump right in!

User Research For Expert Systems

I’d like for you to think of your favorite app that you use almost every day. What do you use it for and why? Next, I’d like for you to think of the last time the app had a major design change that made you think, “What was the company thinking? Why would they change something that worked perfectly fine and make it so unusable? Did they not consult actual users before making this change?”

Empire Office Selects Goliath Technologies to Gain Critical Insights into Remote Worker Trends

Goliath Technologies, a leader in end-user experience monitoring and troubleshooting software, announced today that it was selected by Empire Office to anticipate, monitor, and document Empire’s end-user experience across their Citrix environment.

Elasticsearch vs. MongoDB

Elasticsearch and MongoDb are the two most popular distributed datastores used to manage NoSQL data. Both of these technologies are highly scalable and have document-oriented design at the core. There are differences between the two technologies, however, and it’s important to understand these differences in order to choose the right one for your use case. This blog post will examine the differences between these two technologies in a number of critical areas.

AppOptics Application Service Map

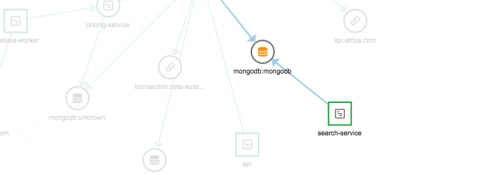
Announcing automatic dependency mapping in SolarWinds AppOptics When your team responds to a latency alert on a single service, how do they know how (or if) the increased latency in one service affects the end user? With the SolarWinds® AppOptics™ service map, teams can easily view the relationships between services, and see how (or if) a service is connected to the end user.

Building an Effective Alert Strategy

Alerts are an essential part of performance monitoring. Alerts and notifications need to be sent out as soon as an issue is identified, allowing you to know about any problems before your customers do. In this week’s Tip Tuesday, we look at building an effective alert strategy and how to utilize Catchpoint Alerts so that you can quickly and effectively leverage the information provided to take carefully targeted action and improve your MTTR. Building an effective alert strategy is important.