Operations | Monitoring | ITSM | DevOps | Cloud

Latest News

New in Grafana 7.0: Trace viewer and integrations with Jaeger and Zipkin

Moving to a scalable, distributed microservice architecture poses a great deal of challenges for any organization. It gets harder to understand the system and pinpoint where errors originate. Logs get much messier, and stitching together a coherent picture of a particular request can be time-consuming or downright impossible. Distributed tracing can help with all of that.

A note of appreciation from our CEO - Business Continuity Edition

Dear SCOM community, It's been 8 weeks since we launched the free Business Continuity edition (BCE) of our SCOM dashboarding product, and I’m glad to see that many community members have taken us up on the offer. The early feedback we received was encouraging and heartening, and we are happy to have helped ease the pressure on IT teams during these uncertain times, in however small a way.

A Tour of 7 Popular Ruby Frameworks in 2020

Ruby may be over 25 years old, but it remains popular in the software community for its focus on programmer happiness. Building software with Ruby often involves leveraging one or more popular frameworks for the purpose of increasing productivity by relying on existing solutions to common problems. Ruby frameworks generally fall into two categories: web-facing frameworks and background job frameworks.

Integrating dynamic SaaS hosted Uptime Monitoring into your customer-served Applications

Imagine you are rolling out your application to multiple customers, they even might use it on premise. Of course you want to know if your application is running fine and the customer is not experiencing any kind of trouble or downtime - surely you would not want to ship this validation in your own system, as that might also be prone to any kind of error at some point. Which is why you decide to go for a third party uptime monitoring solution e.g. Uptime Monitoring.

Citrix Analytics for Performance - Where does it fit in relation to Citrix Performance Monitoring and Management?

I recently published an article on Citrix Performance Analytics (also called Citrix Analytics for Performance), part of the Citrix Analytics service in Citrix Cloud. In this article, i will analyze where Citrix Performance Analytics fits in relative to other Citrix performance monitoring and management tools in the market.

A time machine for your env variables

One of the great things about Lumigo is that it records a lot of context about each Lambda invocation. This includes the invocation event and its return value, as well as the environment variables that were in use at the time. I find this super helpful because it gives me all the relevant information about an invocation in one place. I don’t have to jump between different screens to find the relevant information and then piece the clues together in my head.

Kubernetes performance monitoring

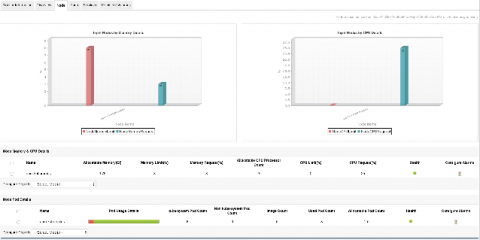
Kubernetes is an open source-system for managing containerized applications across multiple hosts. It aims to provide a “platform for automating deployment, scaling, and operations of application containers across clusters of hosts.” Originally developed by Google, it is now maintained by the Cloud Native Computing Foundation (CNCF).

GrafanaCONline Day 6 recap: The power of Tanka, and a peek into the world of beehive monitoring with Grafana dashboards

GrafanaCONline is live! We hope you’re able to catch the great online sessions we have planned. If you aren’t up-to-date on the presentations, here’s what you missed on day 6 of the conference.

Cortex v1.1 released with improved reliability and performance

Today we’re releasing Cortex 1.1, the first (minor) release since Cortex went GA in March, over 6 weeks ago. This release represents more than 140 commits by over 30 different authors from 9 different companies. In this post we’re going to give you some of the highlights of this release.