Operations | Monitoring | ITSM | DevOps | Cloud

Latest News

Architectural Pattern for Highly Scalable Serverless APIs

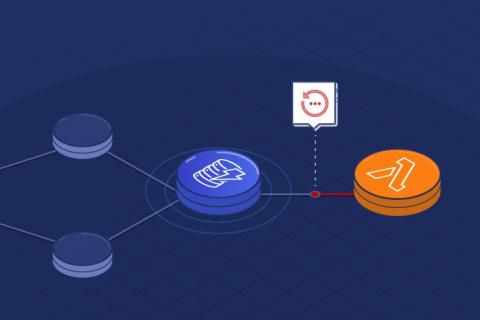
The most common API architecture on Serverless backends is not necessarily the most scalable and resilient option. Many developers take for granted that an AWS Lambda processing external requests will require an API Gateway endpoint connected directly to it. One of the best options to decouple a Lambda function and an API Gateway endpoint is by using an SQS queue. Requests come into API Gateway, which are sent as messages to SQS.

Jaeger clients and W3C Trace-Context

In this article, we are going to have a look at using Jaeger clients with W3C Trace-Context propagation format. The standardized context propagation format assures interoperability between different tracing systems and instrumentation libraries. In this regard we are going to explore two use cases. First how to use OpenTelemetry SDKs in Jaeger instrumented environment.

The New Cloud Strategy in 2020

In recent weeks we’ve all been disrupted by the Covid-19 pandemic, both personally and professionally. The changes have been swift and severe, bringing new meaning to the Boy Scout motto: “Be Prepared.” While certain sectors, like the restaurant industry, have been brutally affected by lockdowns, we’ve also seen encouraging signs of last-minute ingenuity. At the end of March, national chain The Cheesecake Factory warned that it would not be able to pay rent.

Stack Trace Monitoring: Gaps in Measuring the User Experience

Our digital world is evolving and advancing at an unimaginable pace – and so are the expectations of end users. Momentum is everything in today’s united world, and having a poor performing website or application will likely result in the confidence of your products and services. And worse yet, any dissatisfaction perceived from the user will also likely result in them going straight to your competitor. This is an immediate impact on your revenue, brand, and customer confidence.

GrafanaCONline week three: Plugins, Chrome browsing data, Prometheus rate queries, and more

The third and last week of GrafanaCONline starts today! We hope you’re able to check out all of our great online sessions. If you’ve missed any sessions (or want to watch them again), the videos are available on demand here. Here’s what’s coming up today...

Monitoring AWS Application-Related Services

Amazon Web Services (AWS) has a suite of tools that help application development teams enhance and streamline their work experience, from the backend to frontend services. LogicMonitor consolidates data from these services and empowers users to monitor them side by side with the rest of their infrastructure, whether it’s in the Cloud or on-premises. Keep reading for tips on monitoring some of these services to ensure business continuity.

Migrating Management Packs When Upgrading SCOM

Management Packs contain the actual monitoring (the workflows themselves) as well as extend the SCOM platforms functionality and are critical to getting your new SCOM Management Group up and running. The good news is most of SCOM Management Packs that worked with SCOM 2012 R2 work right through to SCOM 2019, so you are safe to import them into your new Management Group.

Alert Tuning for Your Upgraded SCOM Environment

If you know which MPs your overrides are stored in, then migrating your current effective tuning is as easy as exporting all of your override MPs, and then importing them into your new SCOM Management Group, assuming you have already imported the MPs containing the monitoring itself. As you also know, in most SCOM deployments, this is never reality across the board.