Operations | Monitoring | ITSM | DevOps | Cloud

Latest News

eG Innovations Named as a Top 10 Global Vendor for Continuous Application Performance Management

Continuous application performance management (CAPM) is a key focus area in the enterprise IT segment. With organizations increasing their focus on digital business services, monitoring and managing the application performance becomes paramount. When a digital business service is slow or down, it impacts the business adversely.

How to collect, customize, and centralize Python logs

Python’s built-in logging module is designed to give you critical visibility into your applications with minimal setup. Whether you’re just getting started or already using Python’s logging module, this guide will show you how to configure this module to log all the data you need, route it to your desired destinations, and centralize your logs to get deeper insights into your Python applications.

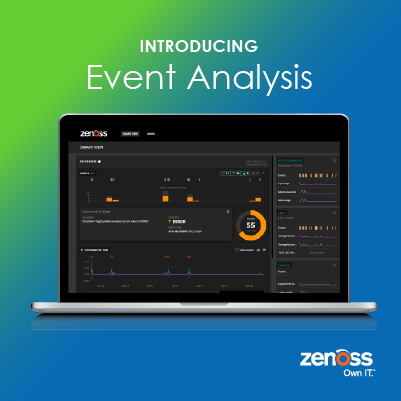
Introducing Event Analysis in Zenoss Cloud

Does it seem like every day we’re doing the same quick fixes? Deleting temporary files to free up space in a file system, bouncing a server, restarting a queue. Over and over. Whether automating these simple tasks or not, you’re responding to incidents that have already affected someone instead of making changes to prevent them from ever happening again.

Common Sentry Settings Roadblocks and How to Overcome Them

Sentry helps developers monitor and fix crashes in real-time. Of course, finding and fixing bugs with Sentry is easier when Sentry itself is set up in a way that minimizes disruption. Our help center and documentation can help with that. We’ve also put together a list of the most common issues our Support team works on with Sentry customers that you’ll find useful (or, at least we hope you do).

Collect Google Stackdriver logs with Datadog

Google Cloud’s Stackdriver Logging is a managed service that centralizes and stores logs from your Google Cloud Platform services and applications. We are excited to announce that Datadog’s GCP integration now includes Stackdriver Logging. You can collect all your GCP logs using Datadog so you can search, filter, analyze, and alert on them along with your metrics and distributed request traces in a single platform.

Is Uptime.com the Right Nagios Core Alternative for You?

Uptime.com and the Nagios monitoring tool serve similar functionality from a surface view. Both alert users to downtime, both offer extensive notification options, and both maintain an API for a variety of flexible use cases. However, these surface distinctions are the extent of the similarities between the two. Nagios Core and Uptime.com serve very different user types, and offer different benefits. You can think of Nagios as your internal safeguard, and there are some challenges to scaling.

[OpsComm March] OpsRamp Breaking New Ground For IT Operations Management

Last month was busy with several key product updates, events and webinars. OpsRamp EMEA controlled the chaos in Europe with our presence in Cloud Expo Europe London, while the US demonstrated OpsRamp’s bi-directional ServiceNow integration with a webinar, and 451 Research’s latest report recognized the company’s innovations in hybrid cloud management. Here’s a quick snapshot of the news milestones that made the month of March.

JBoss Performance Monitoring: The Complete Guide

Ensuring your apps work as designed and deliver a productive user experience starts with monitoring applications metrics. This helps you understand whether your software is performing at optimal levels. Many developers use JBoss (now called WildFly and maintained by Red Hat) to build, deploy, and host transactional applications written in Java.