Operations | Monitoring | ITSM | DevOps | Cloud

Latest News

Leveraging AI for Predictive Analytics in Observability

Predictive analytics has become a key goal in observability. If teams can foresee potential system failures, performance bottlenecks, or resource constraints before they happen, they can act preemptively to mitigate issues. AI holds the promise of making this possible. In this post, we explore how AI can push observability toward predictive analytics, the industry’s current hurdles, and practical use cases for leveraging AI today.

How Cortex Speeds Production Readiness: A Before and After Story

Engineering teams are always shipping something—new services, resources, models, clusters, etc. You probably have a set of standards you expect developers to abide by when doing that work, like adequate testing, code coverage, resolution of outstanding vulnerabilities, etc. But how are you actually tracking and enforcing those standards? Without an Internal Developer Portal, you might find that to be an incredibly manual effort.

What is log analysis? Overview and best practices

In today’s complex IT environments, logs are the unsung heroes of infrastructure management. They hold a wealth of information that can mean the difference between reactive firefighting and proactive performance tuning. Log analysis is a process in modern IT and security environments that involves collecting, processing, and interpreting log information generated by computer systems. These systems include the various applications and devices on a business network.

How Ecommerce Businesses Monitor Web Traffic

Businesses in many industries turn to MetricFire for one goal: to quickly set up hosted monitoring with an expert team. Developers everywhere ask, "Will setting up a monitoring solution with a free trial be worth my time?" How can you find the right monitoring solution for your use case? This article will review some common monitoring use cases for online retail and ecommerce businesses. If any part of this article rings true for your business, click here to contact us.

Email Round-Trip Monitoring Use Cases

Email round-trip monitoring is a powerful tool that tracks the full journey of an email from when it is sent to when it is successfully received. This comprehensive monitoring provides real-time insights into the performance and reliability of email systems, helping to identify issues that could affect uptime, deliverability, and overall communication efficiency.

AIOps monitoring: Definition, uses, and features

AIOps monitoring is a proactive process that uses AI to anticipate and identify IT infrastructure issues. Going beyond traditional troubleshooting, it enables your systems to detect anomalies in advance to prevent potential disruptions. AIOps uses advanced technology like AI and machine learning to simplify IT operations. AIOps monitoring collects and analyzes large data sets from diverse sources, such as logs, metrics, and events.

ITSM Gartner Magic Quadrant: What is The Latest Version?

For years, the ITSM Gartner Magic Quadrant was the go-to resource for businesses seeking the best IT Service Management (ITSM) platforms. It played a crucial role in shaping purchasing decisions, setting standards, and offering insights into market trends within the IT Service Management world. However, in 2023, Gartner replaced the Magic Quadrant for ITSM with the Gartner Market Guide — in which we're proud to be featured.

Feature Friday #32: Doing math in policy with eval()

Ever need to do some math during policy evaluation? Sometimes configuration settings are based on available resources. For example, what if you want to calculate the size of shared buffers to be 25% of your available memory? Let’s write some policy. First, we need to figure out how much memory we have. Let’s parse this out from /proc/meminfo: So, we have 65505464 kB of memory in total. Knowing that we can use eval() to calculate what 25% is. eval() can also be used to test truthfulness.

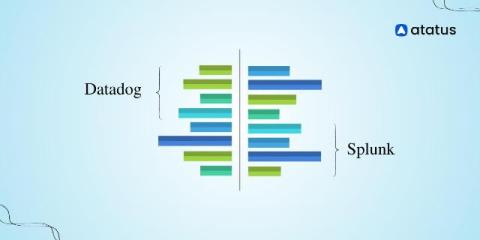
Datadog vs Splunk: A Side-by-Side Comparison [2024]

Datadog and Splunk are both leading tools for monitoring and observability. Each offers a range of features designed to help you understand and manage your data. Datadog provides tools for tracking application performance and analyzing logs in real-time. Splunk, meanwhile, is known for its powerful log analysis and search capabilities. In this post, we will compare Datadog and Splunk on important aspects like APM, log management, search capabilities, and more.