Operations | Monitoring | ITSM | DevOps | Cloud

Latest News

Crafting User-Friendly Solutions: Our Step-by-Step Design Process

Creating user-friendly solutions is crucial as it enhances the overall user experience and increases customer engagement. By making products easier to use and navigate, we ensure that users are more satisfied and likely to continue using them. At Qovery, we continuously deliver new features to enhance the developer experience. In this article, I will present our design process.

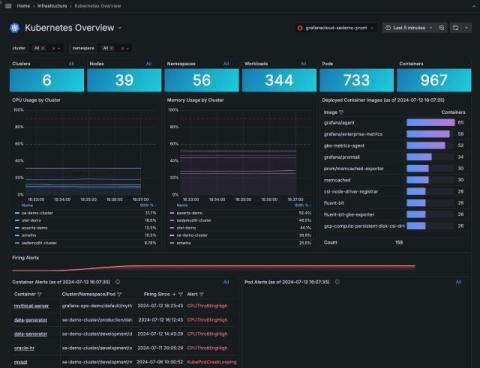
Observe deleted Kubernetes components in Grafana Cloud to boost troubleshooting and resource management

As a site reliability engineer, you need constant vigilance and a keen eye for detail if you want to manage your Kubernetes infrastructure effectively. As part of that effort, you need to see the historical data from your pods, nodes, and clusters — even after they’ve been deleted or recreated. Many SREs rely on kubectl for this, and while it’s indispensable for real-time Kubernetes management, it presents some significant challenges with historical data.

BAU Support: The Key to Efficient Operations

Imagine if your business operations ran like clockwork every single day. That's where BAU support comes in—it's crucial for keeping things running smoothly. BAU, or Business as Usual, might not sound glamorous, but it's the foundation that keeps your organization running smoothly. From applying security patches to providing user support, these routine tasks are vital for maintaining stability and preventing disruptions.

The CoPE and Other Teams, Part 2: Custom Instrumentation and Telemetry Pipelines

The previous post laid out the basic idea of instrumentation and how OpenTelemetry’s auto-instrumentation can get teams started. However, you can’t rely only on auto-instrumentation. This post will discuss the limitations in more detail and how a CoPE can help teams overcome them.

Before you go native in the cloud world, there are a few things you should know

The “cloud native” conversation is transitioning from the enterprise data center into the telecommunications world, just in time for a new generation of 5G and AI/ML enabled telecom services. Couched in that conversation are some important nuances about what constitutes a truly cloud-native solution versus a cloud-capable solution.

Depreciation of IT Assets: Definition, Types & Calculation

Have you ever wondered how businesses manage the value of their technology over time? The depreciation of IT assets plays a crucial role in this process. As technology evolves rapidly, understanding how to account for the decline in value of these IT assets becomes essential for financial health and strategic planning.

Sustaining Digital Resilience With Secure by Design

In today’s complex digital landscape, incorporating security from the ground up is not merely a best practice—it is essential. The recent Azure and CrowdStrike outage underscores the importance of integrating robust security practices into our software development and operational processes. At SolarWinds, we are committed to the principles of Secure by Design, making security fundamental to every phase of our product lifecycle.

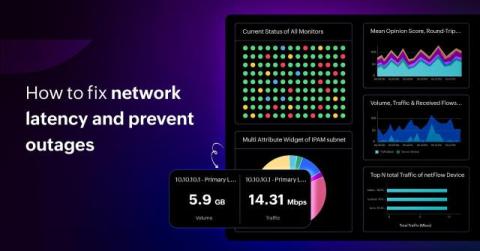
How to fix network latency with network traffic monitoring tools: Use cases and examples

Seamless network performance is the cornerstone of business success. However, network latency—the delay in data transfer initiation—can greatly hinder user experiences, decrease productivity, and even incur financial losses. For businesses aspiring to thrive, it is crucial to address and resolve network latency issues. In this context, network traffic monitoring tools emerge as pivotal solutions.

Navigating IT complexity: Observability vs. monitoring for Australian SMEs' digital transformation

While traditional IT monitoring holds back Australian small and medium-sized enterprises (SMEs) in digital transformation, these organizations do realize that in the realm of IT operations, observability represents a significant advancement over traditional monitoring approaches. Unlike conventional methods that primarily focus on metrics like uptime and error rates, IT observability provides a comprehensive view of system behavior by integrating logs, metrics, traces, and events.

Prometheus vs InfluxDB - Key Differences, concepts, and similarities

Prometheus and InfluxDB are open-source projects created to make application performance monitoring a breeze. That is, of course, if you choose the option that covers your entire observability scope. This article compares and contrasts the extent to which Prometheus and InfluxDB remedy the need for real-time insights into your applications’ operations. We’ll highlight similarities and overlaps in both usability and practicality.