Operations | Monitoring | ITSM | DevOps | Cloud

Latest News

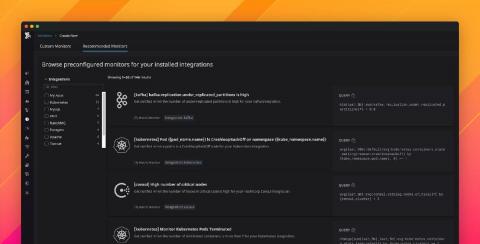
Enable preconfigured alerts with Recommended Monitors

Datadog’s more than 400 integrations collect monitoring data from across your entire stack, giving you full visibility into the health and performance of your applications and infrastructure. Alerts are a crucial part of any monitoring workflow, as they draw your attention to problems in your system before they affect your users. But whether you’re migrating to a new environment or integrating a new technology into your stack, it’s not always clear what data you should alert on.

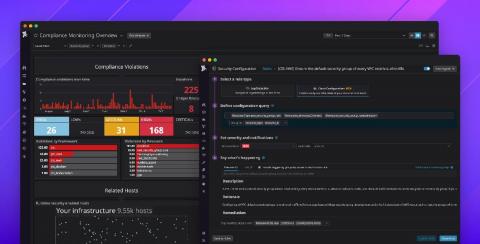
Introducing Datadog Compliance Monitoring

Governance, risk, and compliance (GRC) are major inhibitors for organizations moving to the cloud—and for good reason. Cloud environments are complex, and even a single misconfigured security group can result in a serious data breach. In fact, asset misconfigurations were the leading cause of cloud security breaches in 2019. This puts a lot of pressure on developer and operations teams to properly secure their services and maintain regulatory compliance.

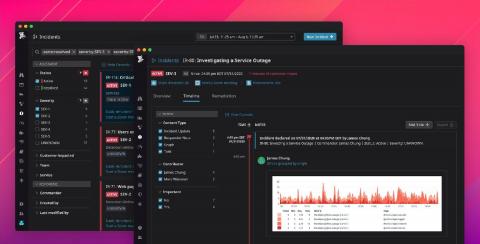
Incident Management with Datadog

When your application experiences an outage, the tools your team uses to manage its response can make all the difference in how quickly they resolve the problem and avoid it in the future. An effective incident management workflow depends on accessible, integrated tools as well as clear, direct channels of communication. And, even after the matter’s been resolved, documentation and analysis of an outage is vital to ensuring it never happens again.

Dash 2020: Guide to Datadog's newest announcements

Today, at Dash 2020, we unveiled new products and features on the Datadog platform that provide engineering teams with even deeper visibility into their distributed applications and infrastructure. With these additions, Datadog further streamlines every step of your release cycle, from shift-left testing in your CI/CD pipelines to profiling your code in production.

My first Kubernetes cluster: Amazon EKS review + tutorial

During my career, I’ve taken part in many on-call rotations and post-mortems. The longest on-call rotation I’ve ever had — no breaks, vacations, or holidays — lasted for a whopping 2.5 years at Lucid Software. I’m jaded. I strongly prefer stability to tinkering with shiny new toys. Very few software engineers start this way, but enough of them make the transition after having been bit enough times by a bad release.

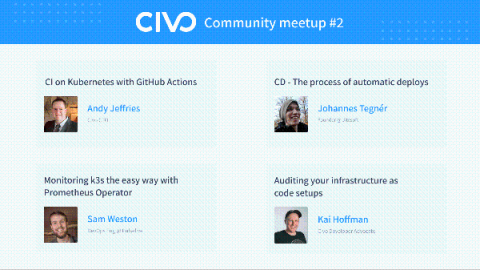
Civo Community Meetup #2: CI/CD focus w/ Sam Weston and Johannes Tegnér

For our second community meetup we focussed on using Civo for CI/CD through GitOps and Github actions for cloud native application development This installment featured talks from our CTO Andy, our Developer Advocate Kai, and guest talks from community members Sam Weston and Johannes Tegnér. The talks touched on a wide variety of topics within CI/CD, from automating builds to monitoring and observability. Here's what was on the agenda...

AppSignal Ruby Gem 2.11: Active Job and Friends

We just released Ruby Gem 2.11. We are always making things easier to use for you, so more things work out of the box and more instrumentation and dashboarding is built without you doing any heavy lifting. This release has a big overhaul of Active Job support. The cherry on the stroopwafel cake is the automatically generated dashboard with status per queue, queue throughput and queue times. 2.11 also polishes a lot of other integrations. Let’s dive in.

Resolve Systems Named a Strong Performer in Infrastructure Automation

We are excited to share that Resolve has been named a Strong Performer in “The Forrester Wave™: Infrastructure Automation Platforms, Q3 2020.” This report evaluates how the 13 most significant infrastructure automation platform providers measure up and helps infrastructure and operations professionals select the right solution for their needs.

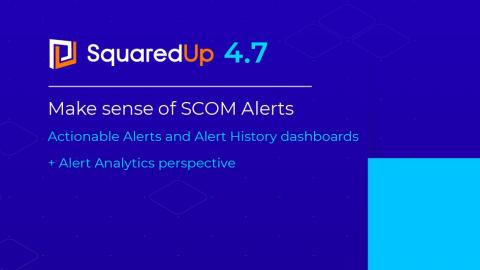
Make sense of SCOM Alerts with SquaredUp 4.7

One of the most common complaints about SCOM is the noisiness of alerts from Management Packs. Getting on top of these alerts can be a huge challenge and often the thing that most gets in the way of an organization getting value out of SCOM. In SquaredUp for SCOM 4.7, our recent feature-packed update, we bring you three new alert-handling super-powers to help you get on top of alerts.

New in Grafana 7.1: Gain new data insights with InfluxDB and Flux query support

The audience was buzzing when Ryan McKinley, VP of Innovation at Grafana Labs, demoed the new native support for InfluxDB Flux queries in his talk at the InfluxDays virtual conference in late June. Whether the goal is to build IoT applications, or monitor DevOps infrastructure or another application or system, it’s important to move beyond just visualizing the data.