Operations | Monitoring | ITSM | DevOps | Cloud
Latest News
Azure Functions Live - June 2020
SRE: A Human Approach to Systems
Protect Your AWS Infrastructure with GuardDuty and Coralogix
Cloud environments like AWS can be a challenge for security monitoring services to operate in since assets tend to dynamically appear and disappear. Making matters more challenging, some asset identifiers that are stable in traditional IT environments like IP addresses are less reliable due to their transient behavior in a cloud service like AWS. Amazon GuardDuty protects your AWS environment with intelligent threat detection and continuous monitoring.
AWS EBS Volumes: 5 Ways to Optimize Performance and Costs
Amazon Elastic Block Store (EBS) provides block storage for applications that are running in the cloud. However, not every company is getting the most out of the EBS volumes they are using. Some companies can pay too much for EBS volumes without utilizing the allocated storage and IOPS. Other organizations may pay high prices because they are using the wrong disk type for their needs. This article explains five techniques you can use to optimize the performance of your EBS workloads.
New Feature: Add Custom Metrics For Node.js in AppSignal
You can now monitor any metrics you’d like in your Node.js app with AppSignal. With custom metrics and minutely probes by your side, you’ll now have an excellent overview of your app. If you’ve ever thought “I wish we measured this specific thing so I could monitor better what is going on…”, then this feature is perfect for you.
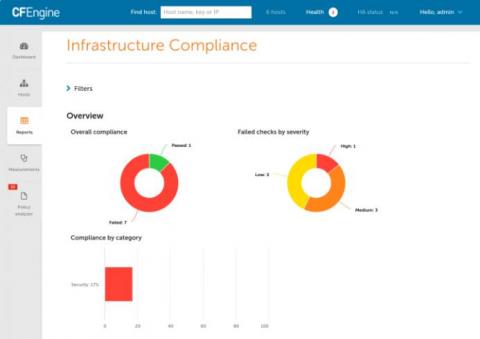
CFEngine 3.16 - Compliance
Today we announce the newest additions to CFEngine. CFEngine 3.16 brings several improvements, bug fixes, and new features. The theme for this release has been compliance, and it notably includes a new category of reports for proving compliance to regulation and other compliance frameworks in high level, easy to read reports. If you are interested to learn more about CFEngine, schedule training, or hear about pricing options, feel free to reach out to us!
Proving the Value of IT
There is a value perception gap in IT. It can be a struggle to get past the historical notion that IT is a cost center, rather than a strategic arm of the business. E&Y recently surveyed 300 senior IT professionals around the globe to understand how they are perceived by their C-level executives. The survey found that 67% of CIOs engage with executive peers on matters of budgetary issues and infrastructure management. Far fewer, only 36%, engage in matters of business performance and challenges.
Simplify your IT service delivery with Motadata ServiceOps
Traditionally, IT service management was limited to legacy platforms and infrastructure. Due to a lack of process, interacting with IT teams was frustrating and difficult, resulting in the workforce becoming less engaged, and the gap between the IT team and business growing even further. Since IT service management was already a complicated task for most IT teams, COVID-19 only exacerbated the repercussions.
Netdata Agent v1.23: Kubernetes monitoring & eBPF observability
Deploying and monitoring performance for an entire Kubernetes cluster can be complex. To simplify the process, we’ve added service discovery functionality to eliminate complex configuration, in addition to more advanced monitoring for viewing activity inside containers. Service discovery identifies k8s pods running on a cluster and immediately starts monitoring system performance. All containers are identified, regardless of complexity.


