Operations | Monitoring | ITSM | DevOps | Cloud
Latest News
Performance Metrics and Data Paralysis
Collection doesn’t equal detection. When your eyeballs are pulsing from the stress of looking at multiple screens, logs, performance metrics, and messages of interpretation from your team; it’s challenging not to experience your own personal system overload. “Thinking too much leads to paralysis by analysis.
Announcing AppSignal for Elixir 2.0
In order to be the best 5-in-1 APM tool for Elixir, we’re constantly working on improving how AppSignal works and integrates with your app. With AppSignal by your side, you’ll have a clear overview of your app’s performance after an installation process that we keep fast and simple. As a first APM for Elixir out there, we’ve always focused on doing all the heavy lifting and providing Elixir developers with a service we’d love to use ourselves.
How to Choose your Monitoring Solution
When we talk about IT support in an organization, it’s not only about resetting passwords or fixing desktops and printers. The most important task for your IT staff is to regularly monitor your network for any emerging issues or threats, and respond on time to ensure that the problem does not interfere with your productivity. However, in an age of growing networks and small budgets, it’s a challenging task that is not easy to handle manually at all times.
Fast scaling for containerized workloads with automatic headroom
High performing container workloads rely on infrastructure to match application demands at a moment’s notice. From scaling bursts that require instant compute availability, to traffic lulls that create infrastructure waste, it’s important to keep both availability and cost in mind during the life of a production application.
Container security on IBM Cloud
If you’re running containers and Kubernetes on IBM Cloud, you can now enable the key security workflows of Sysdig Secure as a service within your IBM Cloud deployments. This makes it easier for you to implement security tools and policies to ensure your containers and your Kubernetes environment are protected and running as intended. The new container and Kubernetes security features are integrated into IBM Cloud Monitoring with Sysdig and offered as an additional service plan.
Kubernetes network policies with Sysdig
Microservices and Kubernetes have completely changed the way we reason about network security. Luckily, Kubernetes network security policies (KNP) are a native mechanism to address this issue at the correct level of abstraction. Implementing a network policy is challenging, as developers and ops need to work together to define proper rules. However, the best approach is to adopt a zero trust framework for network security using Kubernetes native controls.
How small changes to your SLOs can be SMART for your business - A narrative case study
Secure Chaos Engineering on Kubernetes Clusters Without being a Noisy Neighbor
Get started with Gremlin's Chaos Engineering tools to safely, securely, and simply inject failure into your systems to find weaknesses before they cause customer-facing issues. Kubernetes is a powerful open source platform to build scalable, reliable systems, designed to be extensible and customizable for many use cases. Kubernetes provides the ability to scale individual pods, swap out runtimes, and control access to objects using namespaces.
Tracing with the Grafana Cloud Agent and Grafana Tempo
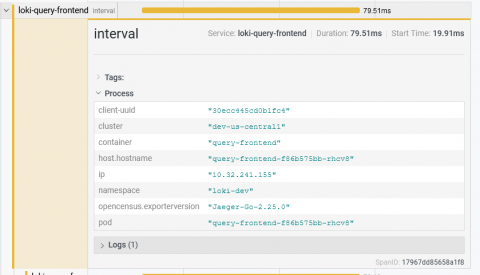
Back in March, we introduced the Grafana Cloud Agent, a subset of Prometheus built for hosted metrics. It uses a lot of the same battle-tested code as Prometheus and can save 40 percent on memory usage. Ever since the launch, we’ve been adding features to the Agent. Now, there’s a clustering mechanism, additional Prometheus exporters, and support for Loki. Our latest feature: Grafana Tempo! It’s an easy-to-operate, high-scale, and cost-effective distributed tracing system.


