Operations | Monitoring | ITSM | DevOps | Cloud
Latest News
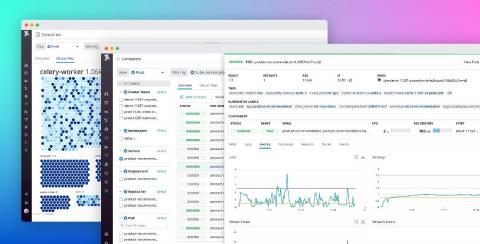
Explore Kubernetes resources with Datadog Live Containers
Running Kubernetes applications requires visibility into not only the overall performance of clusters but also the health of individual pods, deployments, and other resources that make up your environment. Datadog already integrates with your containerized environments and includes features like the Live Container view and the Container Map, enabling you to easily monitor Kubernetes and container runtime performance in real time and get deep visibility into clusters.
Introducing the Grafana Accelerator Program, one of the investments we're making in the community after raising $50 million
This morning, we announced that we raised $50 million in Series B funding. This additional funding, following our $24 million round last October, will enable us to dramatically accelerate research and development at Grafana Labs. We plan to hire more engineers and focus on product innovation. And importantly, it will help us continue to nurture and grow our community of millions of developers around the world.
Identifying and Resolving a Kafka Issue With AppSignal
Last week, we had an issue with one of our Kafka brokers. Don’t worry, it didn’t impact any customers. When monitoring things closely, you can often solve things before they impact a customer ;-). In today’s post, I’ll show you how we use AppSignal to dogfood our own issues. I’ll go through how we monitor the non-Ruby part of our stack and how we used AppSignal to detect and resolve the issue.
Understanding Database Transactions in Rails
Few things are scarier than a database slowly losing integrity over weeks or years. For a while, nobody notices anything. Then users start reporting bugs, yet you can't find any code that's broken. By the time you realize the problem, it may be happening for so long that your backups are unusable. We can avoid problems like these with skillful use of transactions.
Sysdig 2020 Container Security Snapshot: Key image scanning and configuration insights
Today, we are excited to share our Sysdig 2020 Container Security Snapshot, which provides a sneak peak into our upcoming 2020 Container Usage Report As containers and Kubernetes adoption continue to increase, cloud teams are realizing they need to adopt a new workflow that embeds security into their DevOps processes. Secure DevOps, a variation of DevSecOps, embeds security and monitoring throughout the application lifecycle, from development through production.
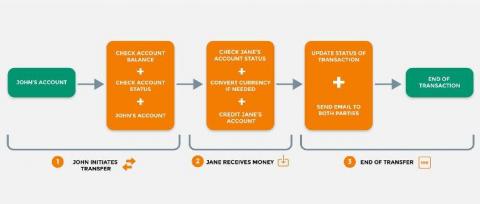
What your company can learn from the Bank of England's resilience proposal
Learn how to modernize your financial systems with confidence while mitigating risk (and meeting compliance). This article was originally published on TechCrunch. The outages at RBS, TSB, and Visa left millions of people unable to deposit their paychecks, pay their bills, acquire new loans, and more.


