Operations | Monitoring | ITSM | DevOps | Cloud
Latest News
Modern shadow IT demands visibility, not control
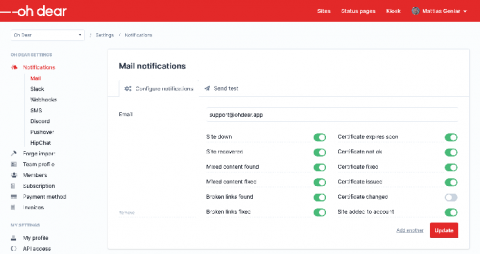
Improvements to our notification system for sending alerts
We added a series of improvements to our notifications settings, making it easier for you to control where your alerts are sent.
Investing In Our Partnership with AWS
Even with a complete understanding of the benefits that come with running a hybrid environment, companies are still challenged with digital transformation best practices: what to move, when to move it, what’s being spent, how it’s performing, and what’s being overutilized and underutilized. This is why Amazon Web Services (AWS) is one of the most strategic partners in LogicMonitor’s ecosystem.
Top 10 Reasons Why NMS is A Must Have
Nothing’s worse than getting a call from the users that the network is down. Too often, IT lacks the visibility they need to get before performance issues arise, meaning you’re in the dark until a user or customer calls to complain. Once an outage happens, the clock is ticking. And the more time you take to understand and resolve the issue, the more it costs you: in terms of customer dissatisfaction, and also staff time & lost productivity.
Challenges using Prometheus at scale
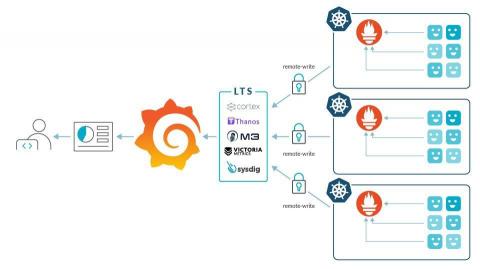
This article will cover the most common challenges you might find when trying to use Prometheus at scale. Prometheus is one of the foundations of the cloud-native environment. It has become the de-facto standard for visibility in Kubernetes environments, creating a new category called Prometheus monitoring. The Prometheus journey is usually tied to the Kubernetes journey and the different development stages, from proof of concept to production.
Runtime Security in Rancher with Falco
Runtime security for Rancher environments requires putting controls in place to detect unexpected behavior that could be malicious or anomalous. Even with processes in place for vulnerability scanning and implementing pod security policies and network policies in Rancher, not every risk will be addressed. You still need mechanisms to confirm these security barriers are effective and provide a last line of defense when they fail.
Tutorial: Shipping Docker Metrics to Logz.io
Docker is an essential bridge in modern DevOps. Despite Kubernetes overtaking Docker on orchestrating containers, the Docker container itself remains the standard and likely will for the foreseeable future. We developed the Docker Metrics collector to operate as its own container that will run Metricbeat using the modules you are running in real time. Now, in addition to the Docker module, we are now releasing an AWS module for operations in the cloud.
Introduction to Azure Functions 3.0
Our roadmap for the new Docker image API and pipeline build step enhancements
In our previous announcement for the removal of the Codefresh Docker registry, we presented a timeline of the migration phases along with the actions expected from our customers. One of the milestones in the migration process is the introduction of our new Image API along with several enhancements on the pipeline build step. We believe that these features deserve a dedicated explanation of why they are useful on their own (regardless of the registry removal).


