Operations | Monitoring | ITSM | DevOps | Cloud

Monitoring

The latest News and Information on Monitoring for Websites, Applications, APIs, Infrastructure, and other technologies.

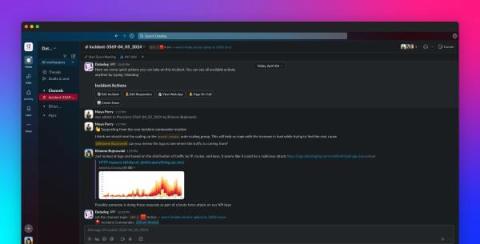
Manage incidents seamlessly with the Datadog Slack integration

Modern, distributed application architectures pose particular challenges when it comes to coordinating incident management. DevOps, SREs, and security teams—often spread out across separate locations and time zones, and equipped with limited knowledge of each other’s services—must work quickly to collaboratively triage, troubleshoot, and mitigate customer impact.

Kubectl Top Pod/Node | How to get & read resource utilization metrics of K8s?

Kubectl Top command can be used to retrieve snapshots of resource utilization of pods or nodes in your Kubernetes cluster. Resource utilization is an important thing to monitor for Kubernetes cluster owners. In order to monitor resource utilization, you can keep track of things like CPU, memory, and storage. In this article, we will see how to use kubectl Top command to get and read metrics about pods and nodes. We will also breakdown the output to understand what it means.

Empowering Excellence: Celebrating Five Years of Trust and Innovation

At ScienceLogic, we’re thrilled to mark a significant milestone: five consecutive years of earning TrustRadius’s Top Rated award. Since 2016, the TrustRadius Top Rated Awards have been the B2B industry’s standard for unbiased recognition of excellent technology products. Based entirely on customer feedback, results have never been influenced by analyst opinion or status as a TrustRadius customer.

How to Stream AWS Logs to Grafana Cloud via Amazon Data Firehose | Grafana

In this video, we show you the steps to configure your Grafana account so you can start streaming AWS logs to Grafana Cloud using Amazon Data Firehose. It takes just a few minutes to set up so you can see your logs in Grafana Explore. Save money and time by using this new approach!

Monitoring vs Observability: What is Reality?

Before we start, I have a confession: I absolutely love Digg (people are still Digging things, right?) errr...Reddit. It actually is my front page to the internet, where I research upgrades for my home lab/VR/other niche hobbies, watch silly videos, ingest low-effort memes, judge if people are ‘AHs’ or not on /r/amitheasshole, and occasionally talk trash to other Redditors about my Michigan-based sports teams.

Network traffic analysis for today's IT

When there is a radical evolution of technologies that promise improved operational benefits, many challenges beyond a network administrator's typical scope emerge. Organizations need to determine effective strategies to manage the potential setbacks that can result from these complexities as well as address the evolution of cyberthreats. With network traffic analysis and awareness of the potential challenges these technologies pose, network admins can ensure their network remains resilient.

Unlocking insights: Learn to deal with deadlocks and blocks with an SQL monitor

Deadlocks and blocks are two types of concurrency issues that can occur in an SQL Server environment. Understanding and addressing these issues is crucial for ensuring the performance and reliability of your SQL-based applications. First, let’s look at the concept of locks, blocks, and deadlocks.