Operations | Monitoring | ITSM | DevOps | Cloud
Networks
The latest News and Information on IT Networks and related technologies.
DPA Virtualized Database Video
N-able Announces New Addition to Its Executive Leadership Team, Naming Jeff Nulsen as Chief Marketing Officer
Transforming Network Monitoring For The "Everything-As-A-Service" Era
Modern applications enable enterprises to scale faster with better efficiency and resilience. The main advantage of a multi-cloud/hybrid cloud infrastructure is in its highly distributed architecture that offers proximity – bringing end users closer to the service provider.
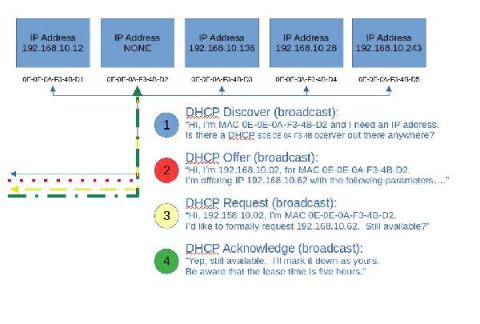
Basic DHCP concepts
Let’s step back and take a very basic look at DHCP. In fact, let’s look at the analogy of assigning a street address to your house. Usually, this is done by the local 911 dispatch office, or some other central authority. They typically use either a survey map or a latitude, longitude pair to locate you, before they assign your house numbers from a pool of available addresses, compatible with other addresses in the area.
How to Troubleshoot Network Issues | Obkio
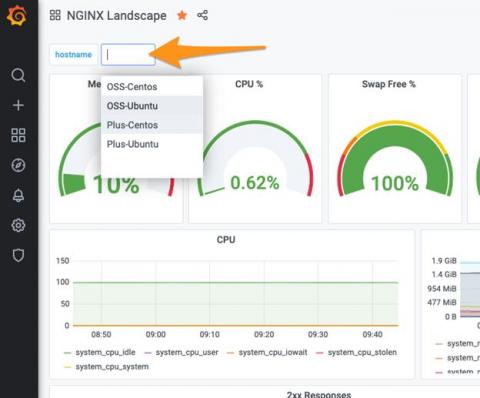
Using Grafana to measure the health of your NGINX instances with NGINX Instance Manager
Grafana is an extremely powerful application and infrastructure observability and health platform. The ability to quickly generate operational insights from an amalgamation of sources is compelling. Grafana also benefits from the ability to natively query a Prometheus endpoint to display time-based metrics for display in a dashboard. We’ve built the NGINX Instance Manager tool to measure the health of your NGINX instances with the help of Grafana.
Ribbon IP and Optical Solutions for Research and Education Networks RENs
What The Future of Automated Network Operations Looks Like
Running a network operations center has never been simple, yet the scale and complexity that digital transformation has added makes the future of automated network operations look downright dizzying.


