Operations | Monitoring | ITSM | DevOps | Cloud

%term

Citrix Monitoring: How to properly monitor Citrix Virtual Apps and Desktops stacks?

Citrix provides a tool called Citrix Director for monitoring Citrix Virtual App and Desktops (CVAD), formerly known as Citrix XenDesktop/XenApp. While this is a great tool for providing day to day end user support with real-time health information about CVAD software components and user sessions, there are a few important differences compared to an Enterprise Monitoring Platform, such as Microsoft System Center Operations Manager (SCOM). You should know this when monitoring CVAD stacks.

The Top 10 Metrics a Citrix Administrator Must Monitor in Their Environment

Citrix application and desktop virtualization technologies are widely used by organizations that are embarking on digital transformation initiatives. The success of these initiatives is closely tied to ensuring a great user experience for end users as they access their virtual apps and desktops.

Serverless Web Apps with AWS and Kotlin

This post takes a look at Kotlin, a relatively new programming language that runs on the JVM, and explores how it can be used to build serverless web apps on AWS using Lambda and API Gateway. In programming language terms Kotlin is a relative newcomer. It was first announced in 2011 by JetBrains, the makers of IntelliJ IDEA, and was designed as a modern successor to Java.

Gain more control of your incidents with Incident Split & Merge

Usability and control are key elements in BigPanda’s Operations Console, where IT Ops, NOC and DevOps users investigate and take action on IT incidents. Let’s take a look at how BigPanda’s powerful Split Incident and Merge Incidents features provide IT Ops with an added layer of control. BigPanda’s Open Box Machine Learning correlates and enriches the overwhelming amount of alerts IT Ops needs to deal with into a reduced number of insight-rich incidents (often 95% fewer).

Downtime Alerts: An Ideal Custom Setup

04 Jul 2019 Ryan Glass, lead developer at Downtime Monkey and director of Big Toe Web Design gives us the recipe for his ideal downtime alert setup... Yes! At Big Toe we use it for all our website monitoring. As well as building sites, we manage the hosting of our client's websites and we monitor these to make sure that they are up and running round the clock. That depends on the site/client.

Distributed Tracing with Jaeger and the ELK Stack

Over the past few years, and coupled with the growing adoption of microservices, distributed tracing has emerged as one of the most commonly used monitoring and troubleshooting methodologies. New tracing tools and frameworks are increasingly being introduced, driving adoption even further. One of these tools is Jaeger, a popular open source tracing tool. This article explores the integration of Jaeger with the ELK Stack for analysis and visualization of traces.

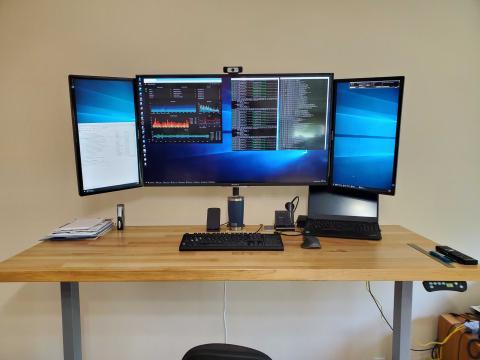
Inside Grafana Labs: Our Workspaces Revealed

A post-geographical culture means more than putting a face to the name. Here, the Grafana Labs team is also putting a photo to the workspace. Check out the setups that have been where some of the latest Grafana releases and products have been developed. What you’ll learn is that not only is the Grafana Labs team adept at creating dashboards, supporting hosted services, and hosting conferences.

Elasticsearch Service: Getting Started with Hosted Elasticsearch

Elasticsearch Service is a hosted Elasticsearch and Kibana solution from Elastic. Get started with a free 14-day trial (no credit card required). https://www.elastic.co/cloud/elasticsearch-serviceElasticsearch Service makes it easy to deploy and manage your Elasticsearch clusters. Just tell us the size of your cluster, your preferred cloud provider, and the geographic location; we take care of the rest.

24/7 Outside-in Web Application and User Experience Monitoring

SolarWinds® Pingdom® is used by Traxo to provide an outside-in, third party assessment of the availability and performance of the web services they provide to the travel industry. They also use Pingdom to monitor the customer's digital experience so they can make sure they continue to deliver a high level of performance.