Memfault Traces Demo
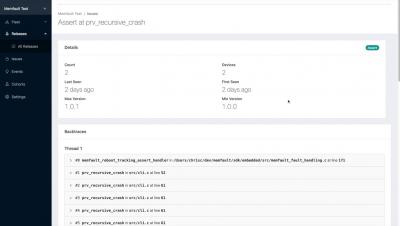
A quick demo video which runs through the Memfault Traces feature.


After our initial release of Icinga Reporting for early adopters we continued our development and are happy to release v0.9.1 today. The release includes bug fixes and some minor enhancements for the usability. I want to take this opportunity to write a post aimed at the people who are new to the whole reporting shabang – like me. This week I set out to figuring out for myself why one would need to use reporting and how to get there – and to share my new knowledge with you!
AWS CloudWatch Logs gives you full visibility into your AWS infrastructure, from individual workloads to the services that bind them. Monitoring these logs helps ensure their smooth and continued operation, ongoing stability, and performance. Integrating CloudWatch Logs with LogDNA makes it easier to parse, search, and analyze AWS logs in order to detect anomalies and troubleshoot problems faster.
Whether you’re investigating memory leaks or debugging errors, Java Virtual Machine (JVM) runtime metrics provide detailed context for troubleshooting application performance issues. For example, if you see a spike in application latency, correlating request traces with Java runtime metrics can help you determine if the bottleneck is the JVM (e.g., inefficient garbage collection) or a code-level issue.
Serverless first came onto the scene in 2014 when AWS Lambda was launched. It offers a dynamic cloud-computing execution model where the server is run by the cloud provider. As with any relatively recent technology, its novelty results in a steep learning curve, and it comes with its own set of benefits and drawbacks.
Python has rapidly grown into one of the most popular languages for automation. That’s why LogicMonitor supports Python when it comes to managing your LM portal and expanding your monitoring coverage with scripts. During your scripting adventures, you may find yourself wanting to take your work to the next level. One widely-applicable improvement is credential abstraction.
Kubernetes clusters use multiple certificates to provide both encryption of traffic to the Kubernetes components as well as authentication of these requests. These certificates are auto-generated for clusters launched by Rancher and also clusters launched by the Rancher Kubernetes Engine (RKE) CLI.
Unless there’s been a huge breakthrough in technology that proves beneficial to employees, or something goes wrong that affects the business’ typical work processes, IT teams’ efforts often go unnoticed. Since significant breakthroughs are few and far between, more often than not, when someone’s contacting IT, it’s with a problem.
Logs Monitoring plays an important role in analyzing, troubleshooting and alerting on problems. Organizations have lots of data in logs that should be mined to get valuable insights on users, applications and systems behavior. Real time alerting from logs monitoring does help in identifying the problems early. It also provides security related insights when someone is trying to break into your organization.