Operations | Monitoring | ITSM | DevOps | Cloud

Debugging

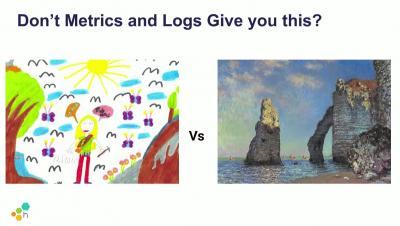
Honeycomb Learn Ep 1 Instrument Better for a Happy Debugging Team

Nathan LeClaire, Sales Engineer @honeycombio knows first-hand that the key to instrumenting code is to start with baby steps. With Honeycomb, a little instrumentation will give vast insights as soon as you ingest your data. With Honeycomb Beelines, we take the heavy lifting out of instrumenting. Listen to learn: See Honeycomb in action, hear best practices, and learn how fast and painless instrumentation can be.

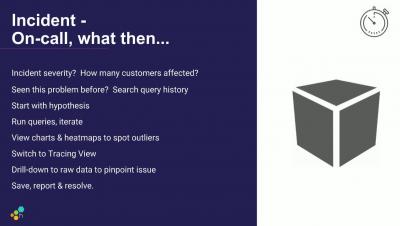
Honeycomb Learn Ep. 2: De-stress Debugging -Triggers, Feature Flags, & Fast Query

This episode in our Honeycomb Learn series looks at how to cut stress levels when debugging issues in production. Starting with a hypothesis, run fast queries, and then navigate to the code where the problem lies. Be proactive and set triggers to let you know if something needs attention. When engineering is about to ship a new release, set a feature flag to watch how production behaves in real-time. Curtail performance issues and reduce customer impact with the right tools to better understand production systems, right now.

Debug errors in Lambda functions

Troubleshooting production issues in Lambda environments is often challenging. CloudWatch requires developers to comb through logs, search for relevant terms that they may not always know of and has hard-to-consume stack traces. For obvious reasons, we recommend using Sentry to instrument your Lambda Functions code in order to report error stack traces and associated debugging context. Here’s a walk through on how to instrument a Node function.

TrackJS for Node

TrackJS error monitoring, on your servers. We’re thrilled to announce official support for Node environments and the 1.0.0 release of our Node agent. We’ve actually had Node since sometime last year, but we’re finally formalizing it as a first-class citizen and fully-supported part of TrackJS! Here are some of the cool things you can do with TrackJS for Node.

Track, Debug, and Fix Errors with Sleuth and Sentry

Learn how the Sleuth-Sentry integration gives you a complete view into your deployment tracking and health! Join us for a virtual webinar with Sleuth co-founder Don Brown and Sentry Product Marketing lead Rahul Chhabria as we walk you thru the benefits of the integration and the insights the combined solution will bring you.

Live Kubernetes Debugging with the Elastic Stack - Philipp Krenn (Elastic)

Your Kubernetes app is down. Your users start ranting on Twitter. Your boss is standing right behind you. What do you do? This talk walks you through a live debugging session without panicking: We are using the Elastic Stack in this demo with a special focus on its Kubernetes integration with metadata enrichment and autodiscovery in combination with APM / tracing, metrics, logs, and health checks.

Debugging, distributed tracing, and profiling for web applications

Google Cloud offers many tools that can help you manage your application services. In this video, we teach you how to set up and utilize Cloud Trace, Cloud Profiler, and Cloud Debugger to collect latency data across different services, memory-allocation information, and inspect application code locations without compromising the performance of your web application.