Operations | Monitoring | ITSM | DevOps | Cloud
%term
Team Tags for "Who is on call" overview
Response time standards
We all like fast sites, especially in 2018. But how can we determine if a website is snappy enough? Are there any response time standards that we can refer to? Do search engines prefer fast-loading sites as well? This article will answer those questions.
Dashing for Icinga 2 v2.0.0 released
Icinga Camp Berlin is happening right now, and as promised in my talk about “Dev and ops stories: Integrations++” we are proud to bring you Dashing for Icinga 2 in its v2.0.0 release ?
Using Machine Data Analytics to Provide the Best Customer Experience - Don't Fly Blind
Introducing Log Processing and Analytics in Datadog
.NET library for detecting temporary / disposable email addresses
We published open-source, simple and easy to use .NET Standard 2.0 library with some useful utilities.
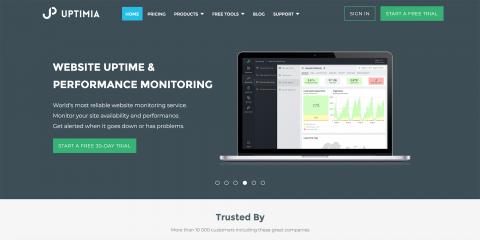
Uptimia greets Spring with a fresh look
It has been around 2 years since we changed our looks, so it is right about time to try something fresh! In addition to design changes, we also updated our free tools - Website Availability Test and Website Speed Test. Even though Availability Tool functionality is the same, Website Speed Test tool has been redesigned completely - now we test website speed from 11 different checkpoints around the globe, to give you a good overview of how your website performs far away from your datacenters.
Goodby Pagers! Hello Prioritized Secure Messaging. Speaker Tim Gee Webinar
Goliath Technologies Launches Performance Monitor for VMware Horizon
Philadelphia, PA – March 6, 2018 – Today Goliath Technologies announced the release of their new Goliath for VMware Horizon product suite. This innovative product provides a different approach to VMware Horizon monitoring that brings together VMware Horizon session data, end user experience, metrics from the underlying infrastructure, and proactive application availability monitoring into a single product and console.


