Operations | Monitoring | ITSM | DevOps | Cloud

%term

Introducing Timeout for Website Monitors

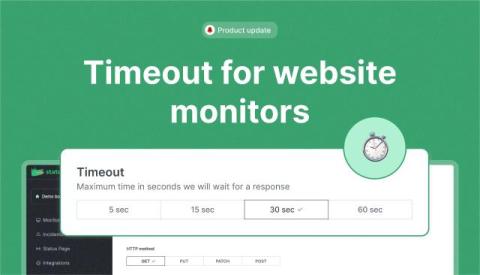
We’ve got a great new feature for your website monitors: timeout configuration! Now, you can fine-tune your monitors by setting a custom timeout – the maximum amount of time (in seconds) you’re willing to wait for a response before considering the service down. You can choose from predefined options of 5, 15, 30, or 60 seconds, allowing for flexibility based on your needs. This feature gives you more control over how sensitive your website monitors are to slow networks.

Status page dark mode logo, now available

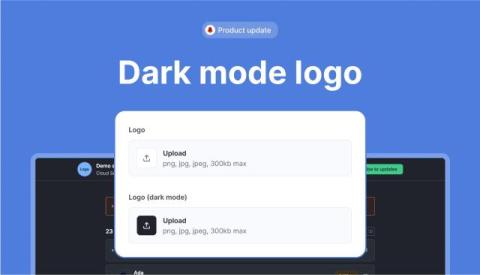
We’ve added a new option to help you customize your status page even further – you can now upload a separate logo specifically for dark mode! This ensures your logo looks great, no matter which theme your users are viewing. To set this up, simply go to the Status Page Settings and head to the Appearance section. There, you’ll find the option to upload a logo tailored for dark mode.

What I Wish I Knew Before Building My First OTel Collector

Starting your journey to build your first OTel Collector can be really exciting, but it can also feel a bit overwhelming. OpenTelemetry, or OTel, is an amazing tool that can help standardize the collection of observability data, but it's normal to feel a bit lost at first. There are lots of little details and best practices that can make the whole process easier, but many of us end up learning them the hard way.

Gain visibility into your Camunda 8 components with Bordant Technologies' Datadog integration

Camunda 8 is a process orchestration platform that automates and executes business processes at scale. Many organizations orchestrate their business processes using Camunda 8 Self-Managed because it can operate in their preferred public cloud provider, such as AWS, or in a private cloud, like a Kubernetes cluster. However, hosting Camunda 8 while maintaining its health and performance will require complete visibility into your environment, helping you properly allocate resources and minimize downtime.

Unleashing the Power of Kentik Data Explorer for Cloud Engineers

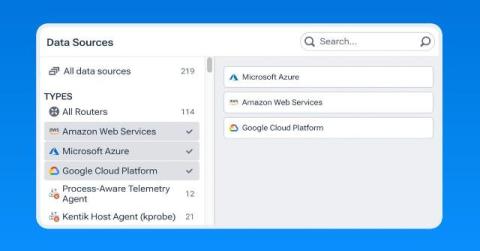
Kentik Data Explorer is a powerful tool designed for engineers managing complex environments. It provides comprehensive visibility across various cloud platforms by ingesting and enriching telemetry data from sources like AWS, GCP, and Azure, and with the ability to explore data through granular filters and dimensions, engineers can quickly analyze cloud performance, detect security threats, and control costs in real-time exploration and historically.

Partnering for the planet: our investment in a supplier education programme to step up environmental responsibility in Pulsant's supply chain

As part of Pulsant’s commitment to make a positive difference to our environment, we recently pushed ourselves forwards in value chain engagement and brought together a cohort of SME suppliers for a series of in-person decarbonisation workshops. In association with sustainability specialists SLR Consulting, our investment in these sessions supported our suppliers in understanding the landscape of decarbonisation and establishing their own action plans.

Breaking the Myths About Service Orchestration and Automation Platforms (SOAPs)

In the ever-evolving IT landscape, new buzzwords and acronyms seem to emerge almost daily, each promising to revolutionize how we manage technology. One such term that’s gaining traction is Service Orchestration and Automation Platforms (SOAPs). You’ve probably seen the news by now: Gartner just released their latest Magic Quadrant for Service Orchestration and Automation Platforms.

Why enhanced connectivity is critical for the future of SaaS applications

Software as a Service (SaaS) is growing at a rapid rate with businesses increasingly reliant on cloud-based solutions. According to the 2024 State of SaaS Growth report, organisations globally now use an average of 371 SaaS applications. This surge in adoption means that IT leaders are tasked with managing a more complex environment, which comes with a suite of challenges. To ensure the performance, security and reliability of these services, network connectivity is critical.

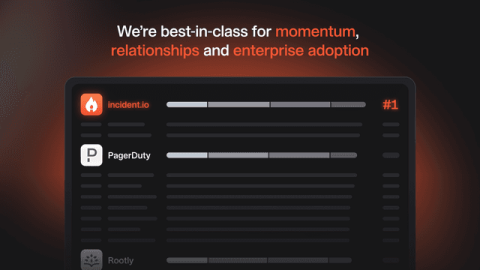
incident.io is best in class for momentum, relationships and enterprise adoption

Trust doesn’t just happen overnight. For us at incident.io, it’s been a journey—one that’s focused on people just as much as the product. From the start, we knew that building great incident management software wasn’t just about creating features and functionality. It was about building relationships, understanding our users, and truly being there for them when it matters most. Our focus has always been to help teams manage incidents better.

Refinery and EMA Sampling

Refinery is Honeycomb’s sampling proxy, which our largest customers use to improve the value they get from their telemetry. It has a variety of interesting samplers to choose from. One category of these is called dynamic sampling. It’s basically a technique for adjusting sample rates to account for the volume of incoming data—but doing so in a way that rare events get more priority than common events. Honeycomb’s query engine can compensate for sampling rates on a per-event basis.