Operations | Monitoring | ITSM | DevOps | Cloud

Product Release

Analyze code performance in production with Datadog Continuous Profiler

To complement distributed tracing, runtime metrics, log analytics, Synthetic Monitoring, and Real User Monitoring, we’ve made another addition to the application developer’s toolkit to make troubleshooting performance issues even faster and simpler. Continuous Profiler is an always-on, production code profiler that enables you to analyze code-level performance across your entire environment, with minimal overhead.

Make sense of application issues with Datadog Error Tracking

When your applications raise errors, you need a way to make sense of them so you can set priorities, start troubleshooting, and gauge the success of your efforts. Errors can appear within the thousands of browser sessions and backend hosts running your software, making it difficult to find meaning within the noise. This is especially true of frontend errors, where seemingly endless permutations of browser version, location, and other environmental details can make it hard to spot trends.

Improve mobile user experience with Datadog Mobile Real User Monitoring

From gaming and social media to e-commerce and travel, mobile is reshaping the way businesses operate and engage with their customers. In an increasingly competitive market, ensuring your mobile applications stay highly performant and resilient will be critical in differentiating yourself from the crowd as well as avoiding uninstalls and poor app reviews.

Introducing Datadog Compliance Monitoring

Governance, risk, and compliance (GRC) are major inhibitors for organizations moving to the cloud—and for good reason. Cloud environments are complex, and even a single misconfigured security group can result in a serious data breach. In fact, asset misconfigurations were the leading cause of cloud security breaches in 2019. This puts a lot of pressure on developer and operations teams to properly secure their services and maintain regulatory compliance.

Incident Management with Datadog

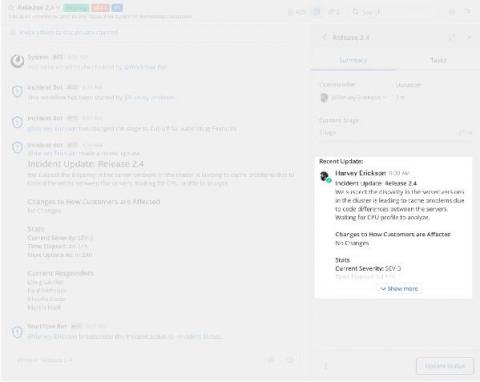
When your application experiences an outage, the tools your team uses to manage its response can make all the difference in how quickly they resolve the problem and avoid it in the future. An effective incident management workflow depends on accessible, integrated tools as well as clear, direct channels of communication. And, even after the matter’s been resolved, documentation and analysis of an outage is vital to ensuring it never happens again.

AppSignal Ruby Gem 2.11: Active Job and Friends

We just released Ruby Gem 2.11. We are always making things easier to use for you, so more things work out of the box and more instrumentation and dashboarding is built without you doing any heavy lifting. This release has a big overhaul of Active Job support. The cherry on the stroopwafel cake is the automatically generated dashboard with status per queue, queue throughput and queue times. 2.11 also polishes a lot of other integrations. Let’s dive in.

Make sense of SCOM Alerts with SquaredUp 4.7

One of the most common complaints about SCOM is the noisiness of alerts from Management Packs. Getting on top of these alerts can be a huge challenge and often the thing that most gets in the way of an organization getting value out of SCOM. In SquaredUp for SCOM 4.7, our recent feature-packed update, we bring you three new alert-handling super-powers to help you get on top of alerts.

New in Grafana 7.1: Gain new data insights with InfluxDB and Flux query support

The audience was buzzing when Ryan McKinley, VP of Innovation at Grafana Labs, demoed the new native support for InfluxDB Flux queries in his talk at the InfluxDays virtual conference in late June. Whether the goal is to build IoT applications, or monitor DevOps infrastructure or another application or system, it’s important to move beyond just visualizing the data.

Introducing, Dashbird Atlas

We’re pleased and honored to be part of the Serverless revolution - continuously innovating to make processes and day-to-day tasks for serverless users more efficient, seamless and enjoyable. So let’s get right into the new and exciting stuff now! Earlier this year, Dashbird launched the very well-received Insights Engine designed to encourage a proactive approach when building and operating serverless applications.

Kubernetes 1.19 release candidate available for testing

The Kubernetes 1.19 release candidate is now available for download and experimentation ahead of general availability later this month. You can try it now with MicroK8s. To get the latest Kubernetes on your machine, install MicroK8s and get a lightweight, zero-ops K8s cluster in no time: Or install from https://snapcraft.io/microk8s and select 1.19/candidate You can install MicroK8s on Ubuntu and all major Linux distributions or on Windows and macOS using native installers.